 Back to all posts
.png)
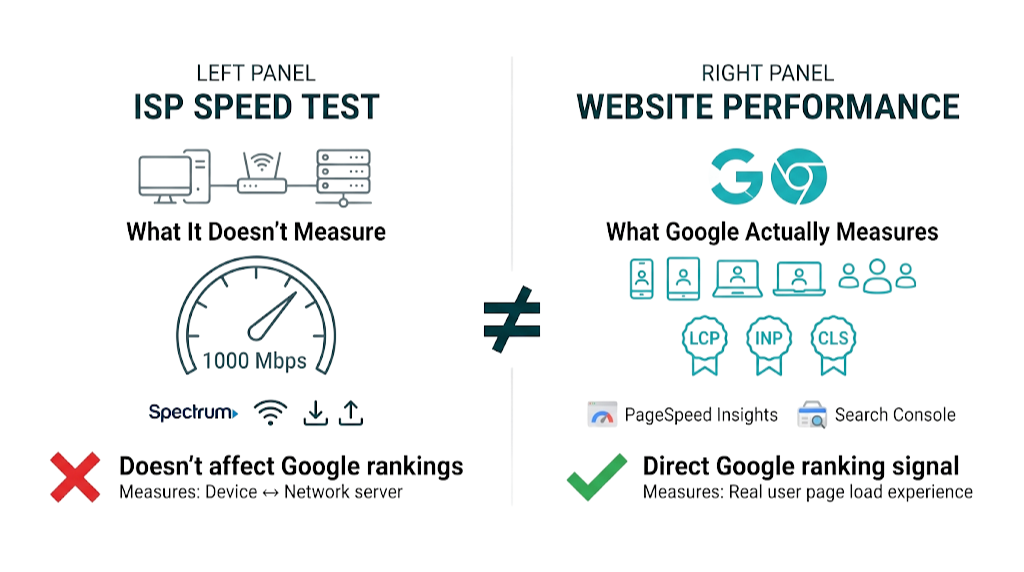
If you've ever run a speed test on the Spectrum speed test site and wondered whether those download speeds have anything to do with your Google rankings, you're pointed at the right theme but the wrong metric. Internet speed and SEO do connect, but the link runs through a different set of measurements than the one Spectrum's tool is built for. Get that distinction right and speed work starts paying off.
The bottom line: Google has used website speed as a direct ranking signal since 2010, and its influence grew a lot with the Core Web Vitals rollout in 2021. But Google doesn't measure your internet speed. It measures how fast your pages load for real users, using Chrome browser data collected at scale. A wifi speed test or an internet speed test free tool like Spectrum's tells you how fast data moves between a device and a network server - not how fast your site loads, not how it scores on Core Web Vitals, and not how it performs in Google's ranking algorithm. These are different measurements. Treating them as the same thing is one of the most common technical SEO issues we see agency clients make.
This article bridges that gap. We'll cover what the Spectrum speed test measures, why it doesn't map to SEO performance, which tools Google uses to evaluate your site, and the seven tactics that push Core Web Vitals scores in the right direction. For a single site or an agency managing dozens of accounts, the framework below helps you prioritize speed work without guesswork.
Why Website Speed Is Now a Direct Google Ranking Signal (Not Just a UX Metric)
Google made it official in April 2010. In a post on the Google Search Central blog, the team announced that site speed would factor into search rankings, marking the first time a technical performance metric sat alongside content relevance and link authority. At the time, it affected a small slice of queries. Over the following decade, that influence expanded.
The bigger inflection point arrived in May 2020, when Google announced the Page Experience signal - a framework that bundled Core Web Vitals with existing signals like mobile-friendliness and HTTPS security. Google's documentation confirmed that Core Web Vitals would become a ranking factor, with the rollout completing in August 2021. This wasn't a small tweak. It was Google wiring page performance into the ranking system.
Why the shift happened matters. Google's business model depends on users trusting search results. If a top-ranked page loads slowly, the user blames Google for the experience, not the site owner. That gives Google a commercial reason to reward faster pages. Speed isn't a UX nice-to-have bolted onto the algorithm - it's a quality signal that protects Google's own product.
The 2024 update made this even more concrete. In March 2024, Google replaced First Input Delay (FID) with Interaction to Next Paint (INP) as an official Core Web Vital. INP measures responsiveness across all interactions during the session, not only the first one. That raises the bar, and a lot of SEO content published before mid-2024 still talks as if FID is the main gate. Sites that passed Core Web Vitals under the FID threshold may now fail under INP - especially JavaScript-heavy pages where interaction delays stack up across clicks, taps, and input.
The practical implication is simple. Speed works as both a direct ranking signal and an indirect one. Directly, Core Web Vitals scores feed into Google's Page Experience ranking system. Indirectly, slow pages drive higher bounce rates, lower dwell time, and fewer pages-per-session - behavioural signals that shape how Google reads result quality. A mid-market SaaS team spending $3k/month on content and link building can watch that spend bleed out if the site loads slowly and users bail.
Competitive SERPs tighten as speed improves across the board. As more teams tune for Core Web Vitals, the baseline rises. A page that was acceptable in 2022 can now sit below the threshold for a "Good" rating in its category. Speed optimization has moved from advantage to requirement.
What the Spectrum Speed Test Site Actually Measures (And What It Doesn't Tell You About SEO)
The Spectrum speed test site is an internet diagnostic tool. It measures the bandwidth available between a specific device and Spectrum's nearest test server. When you run the test, it sends data packets back and forth, calculates how much data moved in a given time window, and reports that as download speed, upload speed, and latency (ping). That's the full scope.
It solves one problem: confirming whether your Spectrum Internet plan is delivering what you're paying for. If you subscribed to Spectrum Internet Gig and you're seeing 200 Mbps on the test, take that up with Spectrum support. The tool is doing its job.
But it tells you nothing about SEO. Not one data point from a Spectrum speed test, a wifi speed test, or any other internet speed test free tool feeds into Google's ranking systems. Google doesn't know or care whether your office has a 1 Gbps fibre connection or a 50 Mbps cable plan. Google measures how fast your website's pages load for the users visiting them - and those users show up on different devices, with different connection types, from different locations.
How to Run a Spectrum Speed Test and Interpret Your Results
Running a test on the Spectrum speed test site takes about 60 seconds. Open the tool, click the start button, and wait for the results to load. It reports three metrics:
- Download speed: How fast data moves from the internet to your device, measured in Mbps. This matters most for typical browsing and streaming.
- Upload speed: How fast data moves from your device to the internet. This comes up in video calls, file uploads, and hosting activity.
- Ping/latency: The round-trip time for a data packet to reach the test server and return, measured in milliseconds. Lower is better.
Here's how those numbers map to real usage: Spectrum's standard plans start around 300 Mbps download, with Spectrum Internet Gig reaching 1,000 Mbps. For a household or small office running multiple devices at once - laptops, phones, a TV via Xumo Stream Box or a similar streaming device - 300 Mbps usually holds up fine. For an agency office with a dozen people on video calls, pay for the higher tier.
Mobile tests follow the same idea. The Spectrum speed test mobile experience works in the browser or via the My Spectrum App, available in the App Store and Google Play. Mobile results come back lower than a wired desktop connection. That's expected. Wifi speed test results swing based on signal strength, device capability, and distance from the router.
Match the result to your plan's advertized speeds. Landing within 20-30% of the advertized maximum is normal. If results stay low across repeated tests, look at router placement, local congestion, or failing hardware, then escalate it to Spectrum support.
Why Your ISP Speed Test Results Don't Reflect Your Website's SEO Performance
This is the distinction most content skips.
A Spectrum speed test measures the connection between your device and Spectrum's server. It's local to your network. It doesn't tell you how your site performs for a user in Manchester, or Chicago, or on a 4G connection in a rural area.
Google's ranking signal uses a completely different data source. The Chrome User Experience Report (CrUX) collects real-world performance data from Chrome browser users who have opted into sharing usage statistics. That data reflects how your pages load across your actual audience - different devices, different connection speeds, different locations. Google evaluates Core Web Vitals at the 75th percentile of that distribution. So the slowest quartile of users decides whether you pass or fail.
A site owner on a 1 Gbps Spectrum Internet connection can still fail Core Web Vitals badly, because the signal comes from visitor experience, not the site owner's bandwidth. The reverse happens too: a site owner on a modest 100 Mbps plan can post strong Core Web Vitals because the site is built and tuned to perform across real visitor conditions.
The Spectrum speed test is a network diagnostic. Core Web Vitals are website performance metrics. Different systems, different inputs, different outcomes. Treating one as a stand-in for the other burns time and creates false confidence.
The 3 Core Web Vitals Google Uses to Rank Your Site in 2024
Google's Core Web Vitals framework currently includes three metrics, each covering a different part of page experience. Passing all three at the "Good" threshold is the target. Miss any one of them and your page won't earn a "Good" Page Experience rating, no matter how strong the other two look.
Metric | What It Measures | Good Threshold | Needs Improvement | Poor |
|---|---|---|---|---|
LCP (Largest Contentful Paint) | Loading performance - time to render the largest visible element | Under 2.5s | 2.5s - 4.0s | Over 4.0s |
INP (Interaction to Next Paint) | Responsiveness - delay between user interaction and visual response | Under 200ms | 200ms - 500ms | Over 500ms |
CLS (Cumulative Layout Shift) | Visual stability - amount of unexpected layout movement | Under 0.1 | 0.1 - 0.25 | Over 0.25 |
Largest Contentful Paint (LCP) maps closest to perceived load speed. It marks the point where the largest element in the viewport - a hero image, large heading, or video thumbnail - has fully rendered. Users read that moment as "the page loaded." An LCP under 2.5 seconds is the Good threshold. LCP usually breaks because of unoptimized images, render-blocking JavaScript, slow server response times, or no content delivery network.
Interaction to Next Paint (INP) replaced First Input Delay in March 2024 and gives a broader view of interactivity. FID only captured the delay before the browser started processing the first interaction. INP tracks the full latency of every interaction on the page - clicks, taps, keyboard inputs - then reports the worst one. Heavy JavaScript execution, third-party scripts, and complex DOM work push this metric in the wrong direction. The Good threshold is under 200ms. INP also exposes issues FID glossed over, especially on single-page applications and news sites running heavy ad scripts.
Cumulative Layout Shift (CLS) measures visual stability. Every time an element moves unexpectedly during page load - an image pops in and pushes text down, or an ad loads late and shifts the content - CLS climbs. The Good threshold is under 0.1. CLS usually comes from images with no defined dimensions, dynamically injected content, and web fonts that swap in after the first render. This is the one that makes users click the wrong button because the page jumped.
That "Good" threshold depends on the data source. Google evaluates these metrics using CrUX field data, not synthetic test scores. A PageSpeed Insights Lighthouse score of 95 doesn't guarantee a "Good" Core Web Vitals rating. If your CrUX field data shows that 26% of real users see an LCP above 4 seconds, you fail - even with a perfect lab score. We'll cover this distinction in more depth in the tools section below.
How Slow Page Speed Kills Conversions and Rankings Simultaneously
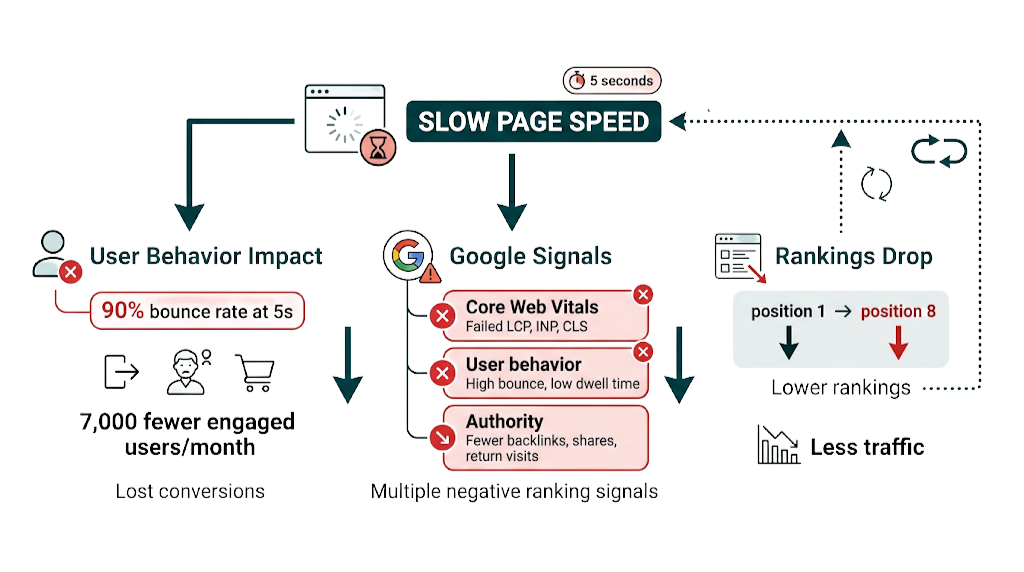
Speed doesn't just affect where you rank. It affects what happens after users arrive. And the two effects compound, which is why slow sites get harder to fix over time.
The numbers are blunt. As page load time rises from 1 second to 3 seconds, the probability of a user bouncing rises by 32%. At 5 seconds, that figure jumps to 90%. For a page receiving 10,000 monthly visits, the gap between a 2-second load time and a 5-second load time can mean 7,000 fewer users engaging with the content.
The conversion impact is direct. An e-commerce site losing 7,000 engaged users per month to bounce isn't just missing conversions - it's paying for traffic acquisition that never reaches the point of value. A B2B site with a slow contact page loses leads before the form loads. A content publisher with slow article pages stacks up negative engagement signals that drag down ranking strength over time.
That same "point of value" ties straight back to rankings. First, the Core Web Vitals signal feeds into Google's Page Experience system. Second, user behaviour follows: high bounce rates and low dwell times tell Google the page didn't satisfy intent, and that feedback loop supports lower rankings. Third, slow sites earn fewer return visitors, fewer social shares, and fewer organic backlinks - signals that widen the authority gap over time.
That authority gap shows up in your data coverage, too. Slow sites that rank poorly get less traffic, which means less CrUX data for Google to evaluate. Pages with thin field data fall back to Lighthouse lab scores for Core Web Vitals assessment - and lab runs punish certain site setups harder than real-world usage does. The spiral feeds itself.
For agencies managing client sites, the priority is simple. Speed work isn't a "nice to have" that sits below content and links. It's the floor. A slow page with excellent content and strong backlinks will keep underperforming a fast page with comparable signals.
The Right Tools to Test Your Website's SEO Speed (Beyond the Spectrum Speed Test)
The right tool depends on what you need to learn. Four tools belong in the regular rotation for any SEO team. Each answers a different question.
1. Google PageSpeed Insights
PageSpeed Insights (PSI) is the speed tool that matters most for SEO because it's the closest public view into the data Google uses in practice. PSI pulls from two sources: CrUX field data, which is real-user data from Chrome, and Lighthouse lab data, which is a controlled synthetic run. The field data drives ranking impact. The lab data helps you troubleshoot.
Pagespeed.web.dev is the entry point. Drop in a URL and PSI returns a report in about 30 seconds. The Lighthouse "Diagnose performance issues" section gets specific fast - eliminating render-blocking resources, sizing images correctly, and other fixes you can hand to a dev team without guesswork.
That field-vs-lab split is the whole point. Keep it in mind as you move from single-page checks to site-wide monitoring.
2. Google Search Console - Core Web Vitals Report
That site-wide view lives in Search Console. The Core Web Vitals report rolls up CrUX field data across the full site, then groups it by URL pattern and status: Good, Needs Improvement, or Poor. This is the operational view teams use to manage speed at scale because it shows which templates fail and how widespread the issue is. If you're not already using it regularly, our guide on how to use Google Search Console covers the setup and key reports in detail.
Template-level failures stand out immediately. If your blog post template is producing Poor CLS across 200 URLs, you see it as a cluster, not as one-off noise.
Those clusters tell you where to focus. To debug the why, you need lab tooling.
3. Chrome DevTools - Lighthouse Audit
Chrome DevTools lets you run Lighthouse with the same lab methodology as PageSpeed Insights, but you get more control over the test setup. You can simulate different network speeds, throttle CPU to mirror mobile devices, and run multiple passes to smooth out variance. DevTools is where engineers work when they're actively chasing down performance regressions.
Control is the advantage here. It turns "we think LCP is slow" into repeatable tests a team can run before and after changes.
When you need deeper request-level detail than Lighthouse provides, switch tools again.
4. WebPageTest
WebPageTest (webpagetest.org) is the most detailed public speed testing tool available. It runs from real browsers in real locations, builds waterfall charts for every request, and supports advanced setups like testing from specific cities, choosing connection speeds, and running filmstrip comparisons between two URLs. For messy LCP or TTFB investigations, WebPageTest shows what PageSpeed Insights won't surface.
Waterfalls make the problem obvious. They also make the fix obvious, which is why this tool earns its keep.
Tools to avoid for SEO speed assessment: Any generic internet speed test free tool, including the Spectrum speed test, Google's own google speed test (which measures your connection, not your site), and wifi speed test tools. These test bandwidth, not website performance. They don't map to Core Web Vitals or Google's ranking signals.
How to Read a PageSpeed Insights Report: Field Data vs. Lab Data
This is the technical detail that decides whether your speed work moves rankings or just moves a score.
Open a PageSpeed Insights report and you'll see Field Data first - the CrUX measurements. This block shows LCP, INP, CLS, and First Contentful Paint (FCP) based on real Chrome user data from the past 28 days. It reflects how the page performs for actual visitors. This is the data that feeds Google's ranking signal.
Scroll down and you hit Lab Data - the Lighthouse synthetic run. It produces the 0-100 performance score most people associate with PageSpeed Insights. That score helps you spot optimization targets, but it isn't what Google uses to rank the page.
Here's the consequence teams miss: a page can post a 95 Lighthouse score and still fail Core Web Vitals in field data. That gap shows up when the synthetic setup doesn't match your real audience - for example, if a meaningful share of users are on older Android devices over 4G, while your Lighthouse run reflects a faster setup.
The reverse happens too. A page with a low Lighthouse score, say 55, can still pass Core Web Vitals in field data if your audience skews toward fast devices and fast connections. Lab data flags opportunities. Field data determines ranking impact.
The rule: lead with field data when you're judging ranking impact. Use lab data to pinpoint what to fix.
7 Proven Tactics to Improve Your Site Speed and Core Web Vitals Scores
Speed optimization isn't one change. It's a stack of fixes, each aimed at a known bottleneck. These seven tactics cover the failure modes we see most often across LCP, INP, and CLS.
1. Optimize and Properly Size Images
Images are the most common driver of bad LCP. Fix it in two places: format and delivery.
Move images to WebP or AVIF - both cut file size versus JPEG or PNG at the same perceived quality. After that, serve responsive variants with srcset so the browser pulls the right asset for the viewport. No one needs a 2000px image on a 375px mobile screen.
The LCP image needs extra attention. For the hero image (or the largest above-the-fold element), add fetchpriority="high" to the <img> tag. That bumps it up the request queue and trims LCP time.
2. Eliminate Render-Blocking Resources
CSS and JavaScript in the <head> can block first render while the browser downloads and parses them. That delay shows up fast in CWV.
Audit the <head> and deal with the blockers: defer scripts with defer, move non-critical scripts to the bottom of the body, and inline critical CSS where it makes sense. Google's PageSpeed Insights calls out render-blocking resources in Diagnostics, so you don't have to guess which files are causing the hold-up.
3. Implement Lazy Loading for Below-the-Fold Content
Below-the-fold images and iframes don't need to load on initial paint. Tell the browser that.
Add loading="lazy" to those elements so the browser waits until the user scrolls near them. That drops initial page weight, gets above-the-fold content on screen faster, and lifts LCP without changing what the user sees.
4. Minimize JavaScript Execution to Improve INP
INP failures almost always trace back to long JavaScript tasks that lock up the main thread. While the main thread runs JS, it can't respond to user input. Clicks, taps, and keystrokes pile up, and INP measures that delay.
Use Chrome DevTools' Performance panel to find long tasks, then split them into smaller chunks with setTimeout or requestIdleCallback. And be ruthless with third-party scripts - analytics, chat widgets, ad networks - because they often run during page load and compete with interaction work on the same thread. For WordPress sites, our WordPress speed optimization guide covers these fixes in a CMS-specific context.
5. Set Explicit Dimensions for All Images and Embeds
CLS often comes down to missing dimensions. If an image or iframe ships without explicit width and height, the browser can't reserve space for it. When it finally loads, it pushes content down.
The fix stays boring because it works: add width and height to every <img> tag. For responsive assets, pair that with CSS aspect-ratio so the layout holds its shape across breakpoints.
6. Optimize Web Font Loading
Web fonts create two problems: layout shifts and extra weight early in the load.
If the font arrives late, the browser renders fallback text and swaps to the web font when it shows up - that's a layout shift. The font file also adds bytes to the critical path, which can drag LCP.
Preload the fonts that matter with <link rel="preload">, set font-display: swap to control fallback behaviour, and self-host fonts instead of pulling them from third-party CDNs where possible.
7. Upgrade or Optimize Your Hosting
Slow Time to First Byte (TTFB) is upstream. Front-end work can't fully offset a server that takes too long to respond.
If your server takes 1.5 seconds before the browser receives a single byte, your LCP won't land under 2.5 seconds - the physics don't allow it. Measure TTFB with WebPageTest. If it stays above 600ms, fix it at the source: move to a faster hosting tier, add server-side caching, or deploy a CDN so users hit edge nodes closer to them.
How CDN Deployment Reduces TTFB and Improves LCP for SEO
A Content Delivery Network distributes your site's static assets - images, CSS, JavaScript, sometimes entire HTML pages - across a global network of edge servers. When a user in Sydney requests a page hosted on a server in New York, a CDN serves that content from an edge node in Sydney. That cuts TTFB.
The performance gains are substantial. TTFB reductions of 60-80% for geographically distributed audiences are well within reach. If a site starts with a 1.2-second TTFB from its origin server, a CDN can bring that down to 240-480ms, which puts LCP in a much better position.
For SEO, CDN deployment is one of the cleanest technical wins because TTFB feeds directly into LCP across the whole site. Image optimization still matters, but it's slow to roll out because you handle it page-by-page. A CDN improves every URL at once. On large client sites with hundreds or thousands of pages, that scope matters, and it usually turns into the best Core Web Vitals lift per hour spent.
Major CDN providers include Cloudflare, which offers a free tier that covers most small-to-mid sites, Fastly, and AWS CloudFront. For WordPress sites, plugins like WP Rocket or W3 Total Cache bundle CDN integration with caching configuration.
How Website Speed Interacts With Link Building and Your Overall SEO Strategy
This is the angle that almost no SEO content addresses - and for agencies managing both technical SEO and link building programmes, it's one of the most important strategic considerations in the entire discipline.
A backlink is an authority signal. When a high-DR site links to one of your pages, it transfers link equity to that URL. That equity only turns into rankings if the page can compete on the rest of the signals Google evaluates. Speed is one of those signals. A high-authority backlink pointing to a page that fails Core Web Vitals wastes ranking headroom.
Google doesn't grade links in a vacuum. Two pages can target the same keyword. Page A has 40 referring domains and passes Core Web Vitals with Good scores across all three metrics. Page B has 55 referring domains but fails LCP and INP. In competitive niches, Page A often wins - because Google weighs the full set of signals, not link authority alone.
For agencies, this creates a clear sequencing argument. Link building works better when the target pages already load fast. Audit the URLs you're planning to push with links, and check their Core Web Vitals first. If they're failing, fix the technical issues, then build links. The same budget drives stronger ranking movement on a fast page than it does on a slow one.
Fast pages also make link acquisition easier over time. More shares. More return visits. More organic citations. Those second-order signals create natural link opportunities without forcing everything through outreach. Slow pages choke those signals and raise the cost of earning links. Speed and link building aren't separate workstreams. They're connected inputs into the same ranking outcome.
At Rhino Rank, we see the pattern across client accounts. The sites that get the most from curated link placements and guest post campaigns are the ones that handled Core Web Vitals first. Speed creates the conditions for link equity to show up as rankings. As Moz explains in their guide to page speed and SEO, a slow website not only impacts rankings but also user experience - and those two effects reinforce each other in ways that compound over time.
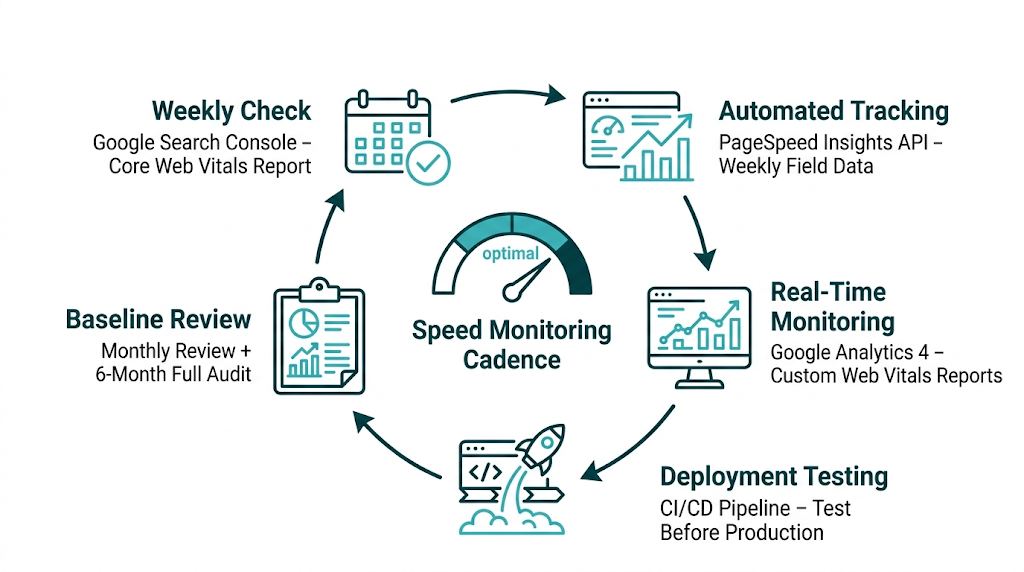
How to Set Up Ongoing Speed Monitoring So Rankings Don't Slip
Speed optimization isn't a one-time project. Sites drift. Plugins get added. Third-party scripts pile up. Images go live uncompressed. A page that passes Core Web Vitals today can fail them six months later without anyone noticing - until rankings drop.
That drift is why monitoring needs owners, thresholds, and a cadence.
Google Search Console - Core Web Vitals report: Check this weekly. Search Console sends email notifications when a meaningful number of URLs move from Good to Needs Improvement or Poor, but don't rely on inbox alerts as your only safety net. Weekly review catches slow decline before it turns into a ranking problem.
PageSpeed Insights API - Automated monitoring: For agencies running multiple client sites, the PageSpeed Insights API supports scheduled score collection. Pull field data for key URLs weekly and log it to a spreadsheet or dashboard. If a score drops below your threshold, open an investigation while the issue is still small.
Google Analytics 4 - Core Web Vitals in custom reports: GA4 can collect Web Vitals data via the web-vitals JavaScript library. You get site-specific field data that isn't blocked by the CrUX minimum traffic threshold. That helps on lower-traffic pages that don't show up in Search Console's Core Web Vitals report because they lack enough CrUX data.
Deployment-triggered testing: Every code deployment should run a PageSpeed Insights test on key URLs. Add PSI API calls to your CI/CD pipeline so performance regressions surface before they hit production. Engineering-led organizations treat this as standard practice. Most agencies don't, and that's a process gap worth closing.
Cadence matters as much as tooling. Set a baseline after the initial optimization work. Review field data monthly against that baseline. Investigate any metric that moves more than 10% in the wrong direction. Then run a full technical SEO audit every six months to catch accumulated technical debt before it turns into a rankings problem.
Frequently Asked Questions About Website Speed and SEO
Is the Spectrum speed test the same as testing my website's speed for SEO?
No - they measure different things.
Spectrum's speed test measures bandwidth between your device and Spectrum's network server. That tells you whether your internet plan is hitting its advertized speeds. Google, on the other hand, looks at how fast your site loads for real visitors based on Chrome User Experience Report (CrUX) field data. Your ISP speed doesn't map to your site's Core Web Vitals scores, and it doesn't feed Google's ranking algorithm.
Does page speed directly affect Google search rankings?
Yes.
Google has used site speed as a direct ranking signal since 2010, and that influence expanded with the Core Web Vitals rollout in 2021. Core Web Vitals - LCP, INP, and CLS - are official Page Experience ranking signals. Pages that hit "Good" across all three metrics get a rankings edge. Pages that miss those thresholds fall behind in competitive SERPs, all else being equal.
What tools does Google actually use to measure website speed for ranking purposes?
Google uses the Chrome User Experience Report (CrUX) - a dataset of real performance measurements collected from Chrome users who opted into sharing usage statistics. That field data gets assessed at the 75th percentile of your visitors, which means Google weights the slower end of your real-world experience, not your best-case loads.
Google PageSpeed Insights is the public tool that exposes this. It shows CrUX field data alongside Lighthouse lab data. Google Search Console's Core Web Vitals report also pulls from CrUX, aggregated across your site.
What is a good page load speed for Google rankings in 2024?
Google's Core Web Vitals thresholds are clear: LCP under 2.5 seconds for a "Good" rating, INP under 200ms for "Good", and CLS under 0.1 for "Good". Those thresholds determine whether a page earns a "Good" Page Experience rating.
Outside Core Web Vitals, we still aim for a fully interactive page within 3 seconds as a practical target. Core Web Vitals carries more weight for rankings than raw load time, so we treat CWV as the benchmark and load time as supporting context.
What is the difference between a PageSpeed Insights score and Core Web Vitals field data?
The PageSpeed Insights Lighthouse score is a synthetic lab measurement. It runs from 0 to 100 and reflects a single simulated page load in a controlled environment.
Core Web Vitals field data comes from CrUX and reflects real user measurements over the past 28 days. That's the dataset Google uses for ranking. Lighthouse helps diagnose issues. Field data decides whether you pass.
A page can score 95 in Lighthouse and still fail Core Web Vitals in field data if real users hit slower devices, weaker networks, heavier pages, or busier main threads than the lab run simulates. Prioritize field data when you're judging ranking impact.
What is TTFB and why does it matter for SEO?
Time to First Byte (TTFB) measures the gap between a browser making an HTTP request and receiving the first byte of the server's response. In plain terms, it's server responsiveness.
TTFB isn't a Core Web Vitals metric, but it puts a hard floor under LCP. If your server takes 1.5 seconds to respond, your LCP won't land under 2.5 seconds, no matter how much front-end optimization you do. We target TTFB under 600ms. CDN deployment is the single most reliable move for reducing TTFB, with research showing 60-80% reductions for geographically distributed audiences.
How does website speed affect bounce rate and conversions?
The impact is large and well-documented. Google's research on page speed confirms that as page load time rises from 1 second to 3 seconds, bounce probability increases by 32%, and at 5 seconds that figure reaches 90%. Conversions follow the same pattern - slower pages drive fewer form completions, fewer purchases, and fewer engaged sessions.
Bounce also feeds into behavioural signals Google can observe. That creates a cycle: slow pages slip, they draw less traffic, and they collect fewer authority signals over time.
How does website speed interact with link building and domain authority?
A backlink transfers ranking equity to a specific URL. That equity only turns into rankings if the page holds up across Google's signals - including Core Web Vitals.
A high-authority backlink pointing to a page that fails LCP or INP won't pull its weight. For agencies running link building campaigns, fixing Core Web Vitals on target pages before building links is the most impactful sequencing decision available. Fast pages get more rankings lift from the same link spend than slow pages sitting in the same competitive slot.
related Blog Posts


Join 2,600+ Businesses Growing with Rhino Rank
Sign Up
Stay ahead of the SEO curve
Get the latest link building strategies, SEO tips and industry insights delivered straight to your inbox.