 Back to all posts

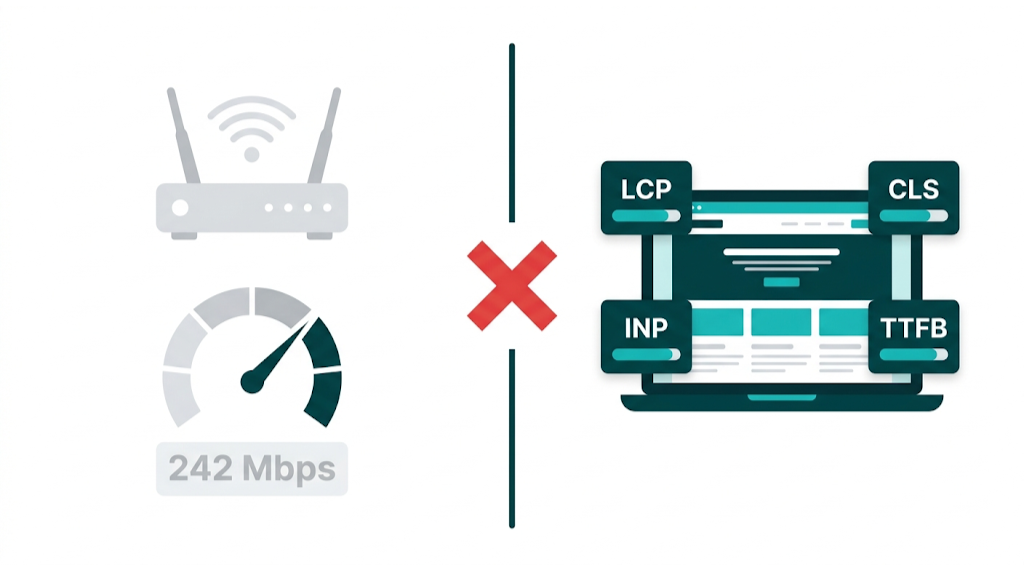
If you've just run a speed test on the Cox speed test site and clocked 242Mbps down with 21ms latency, your connection is fast. Cox internet speed averages hold up, and results like that cover most home and office work without drama. But those numbers still don't tell you how your website performs for real users or how Google scores it for rankings. They're different systems, measured by different tools, and mixing them up is one of the most expensive mistakes SEO managers make when they're chasing "speed" issues.
The bottom line: Your ISP connection speed and your website's page speed are separate systems measured by separate tools. A Cox speed test confirms whether your internet provider is delivering the bandwidth you're paying for. It says nothing about your site's Core Web Vitals, render-blocking resources, Time to First Byte, or Largest Contentful Paint - the metrics Google uses to score page experience. This article gives you the diagnostic framework, the right tools, and the fix prioritisation logic to go from "my site feels slow" to a developer-ready action plan.
That gap matters more now than it did a year ago. Google's Page Experience update raised expectations, and in March 2024 Google replaced First Input Delay with Interaction to Next Paint as a Core Web Vital. The bar moved. SEO teams that treat connection speed like a proxy for rendering performance burn budget, miss root causes, and hand positions to competitors who keep the two separate. We're going to fix that.
What the Cox Speed Test Site Actually Measures (And What It Doesn't Tell You)
The Cox speed test site is a legitimate diagnostic tool - just not for SEO. It measures the bandwidth available between your device and Cox's nearest test server, often inside Cox's network. You run a test, it sends packets back and forth, and it returns three numbers: download speed, upload speed, and latency (ping). According to data from Reviews.org, Cox customers average 242.63Mbps download and 21.55ms latency across tested connections - numbers that put it in the upper tier of US cable internet providers.
Those metrics answer one question: are you getting the speeds you're paying for?
That matters when video calls drop or the network feels unstable. It's the right tool for troubleshooting a slow home network, checking your actual Cox internet speed against the plan advertised, or deciding whether you need to involve Cox support because performance has degraded. Cox built its speed test for this - a customer-facing check on provider delivery, not a web performance test.
A check on ISP delivery won't tell you anything about page rendering. The Cox speed test tells you nothing about:
- Server response time - how quickly your web host returns the first byte of data to a browser
- Resource load order - whether JavaScript blocks rendering
- Image compression - whether your site serves 4MB hero images to mobile users
- Third-party script weight - how many milliseconds your analytics, chat widgets, and ad pixels add to load time
- CDN coverage - whether your content is being served from a location near your users
Your test result also reflects one setup: your location, your device, your Wi-Fi or wired network, and that specific route to Cox's server. It doesn't represent a user in another city on a mid-range Android device over 4G. And it's that user experience - not your office desktop on a 242Mbps Cox line - that Google's systems try to approximate when they score page experience signals.
Page experience signals depend on things the speed test can't see. Server location matters. Code quality matters. Asset delivery matters. A site on a cheap shared server in a single US data centre loads slowly for customers in Europe regardless of how fast their local internet is. The Cox speed test won't catch any of that. It's a pipe test, not a page test. Understanding what makes a good backlink profile is equally important to technical performance when building a complete SEO strategy.
ISP Speed vs. Page Speed: Why Your Cox Results Don't Reflect Your SEO Performance
Mixing up ISP speed and page speed is common. Both get labeled as "speed," both sit somewhere in the internet experience, and both touch UX. But they sit on different layers of the stack. Treat them like the same metric and teams burn hours on the wrong checks while the real bottlenecks stay in place.
Here's the clean split. A Cox internet connection is the motorway. Page speed is what happens inside the warehouse at the end of that motorway. A wider, faster motorway helps. But if the warehouse is disorganized, the lorries are overloaded, and dispatch is a mess, goods still arrive late. The motorway upgrade won't fix the warehouse.
Page speed comes down to things your ISP doesn't control:
Factor | What It Affects | ISP Speed Relevant? |
|---|---|---|
Server response time (TTFB) | How fast your host returns data | No |
Image file size | Download weight per page | No |
JavaScript execution | Render-blocking, interactivity delay | No |
CSS delivery | Render-blocking above the fold | No |
CDN configuration | Geographic delivery distance | No |
Caching headers | Repeat visit load time | No |
Third-party scripts | Added latency per external call | No |
Connection bandwidth | Raw transfer speed | Yes |
Only one row ties back to ISP speed: raw transfer speed. And even there, the relevant connection is the user's ISP speed, not ours.
Google's Lighthouse tool (the engine behind Google PageSpeed Insights) doesn't care that the office line pulls 242Mbps on Cox. Lab tests simulate a mid-tier mobile device on a throttled 4G connection. That's intentional. Google is trying to model the median experience, not the best-case one.
So when an SEO manager runs a Cox internet speed test to diagnose a slow website, the test answers the wrong question. It confirms the pipe works. The SEO performance issue lives elsewhere - in code, server config, the asset delivery pipeline, or the third-party script stack.
Lab data vs. field data matters here, too. Lab data comes from tools like Lighthouse running controlled simulations. Field data comes from the Chrome User Experience Report (CrUX), which aggregates real user measurements from Chrome browsers that visit your site. Google uses both. Field data carries more weight for ranking signals because it reflects what people actually experience across connection types, devices, and locations. A Cox internet speed test is neither of those - it's ISP diagnostic output in a separate measurement universe.
For SEO teams managing site performance, the takeaway stays simple. Use an ISP speed test to confirm the connection is healthy. Then move on to the tools tied to rankings. Running a technical SEO audit alongside page speed work ensures you're not missing other factors that affect how Google evaluates your site.
The Real Tools for Testing Website Page Speed (Not Your Internet Connection)
After the Internet connection check is done - whether that's a Cox speed test, Speedtest.net, or any free test my internet speed tool - page speed work starts in the right place: web performance tooling.
These tools measure what Google measures. They produce outputs we can act on. And they point to the actual reasons a page loads slowly, instead of reporting that the pipe is open.
The professional toolkit for page speed testing has three tiers: Google's own diagnostics, third-party lab testing platforms, and real user monitoring (RUM) solutions. Most SEO audits live in the first two. RUM comes in to validate field data and sanity-check what we see in lab results.
Google PageSpeed Insights: The SEO Standard for Page Speed Diagnosis
Google PageSpeed Insights (PSI) is the non-negotiable starting point for any SEO-focused speed audit. It's free, it's powered by Lighthouse, and it surfaces both lab data and real-world CrUX field data in a single report. You can access it at developers.google.com/speed/pagespeed/insights.
Enter any URL and PSI returns a performance score from 0 to 100, tied to Core Web Vitals plus a set of diagnostic opportunities. Google groups the score into three buckets: Poor covers 0-49, Needs Improvement covers 50-89, and Good covers 90-100. The score itself matters less than the opportunities and diagnostics underneath it. Those call out the exact resources that slow the page down and the estimated impact.
That diagnostic detail is useful, but PSI earns its place in an SEO workflow because of the field data panel at the top of the report. If your URL has enough CrUX data, which requires meeting a minimum traffic threshold, PSI shows how real users experience your Core Web Vitals. This is the data Google uses in ranking decisions. A lab score of 85 paired with poor field data for LCP is a red flag. Real users see a worse experience than the lab test suggests, which usually comes down to server inconsistency, third-party scripts firing at bad times, or personalization layers the lab run doesn't capture.
Run PSI on both mobile and desktop.
Mobile comes first. Google uses mobile-first indexing, so mobile performance drives the ranking signals. As Semrush explains in their guide to PageSpeed Insights scores, a score of 90 or above is considered good - but the Core Web Vitals field data matters more than the aggregate number.
GTmetrix and WebPageTest: When You Need Deeper Diagnostic Data
GTmetrix and WebPageTest sit in the second tier - they're not Google's tools, but they give you diagnostic detail PSI won't. Both are free at their core, with paid tiers for advanced features.
GTmetrix gives you a waterfall chart, video playback of the page loading, and historical tracking across test runs. It also lets you test from multiple server locations - a feature we'll cover in the methodology section. Location testing matters because latency and routing change the load profile, sometimes a lot. You can simulate different connection speeds and device types, which helps when you're trying to match what users in specific geographies see. GTmetrix also scores pages against Lighthouse metrics and its own GT score, so you get two views of the same test data.
That location and load detail still won't replace developer-grade timing breakdowns. WebPageTest, maintained by Catchpoint, is the tool teams use when they need network-level visibility. It generates detailed waterfall charts, filmstrip views of the rendering timeline, and connection diagnostics that isolate bottlenecks like DNS lookup time, SSL handshake delay, and time-to-first-byte variance across multiple runs. Cloudflare's learning resources make the point clearly: run multiple tests from the same location and average the results if you want data you can trust. WebPageTest supports this cleanly with repeat view and multi-run options.
For a complete SEO audit, use PSI for ranking-relevant field data and the first pass on opportunities, GTmetrix for location-based comparisons, and WebPageTest when you need to hand a developer a precise, reproducible diagnosis. If you'd prefer to have this work handled end-to-end, our managed service covers technical audits alongside link building for a complete SEO programme.
Core Web Vitals Explained: The Google Metrics That Actually Affect Your Rankings
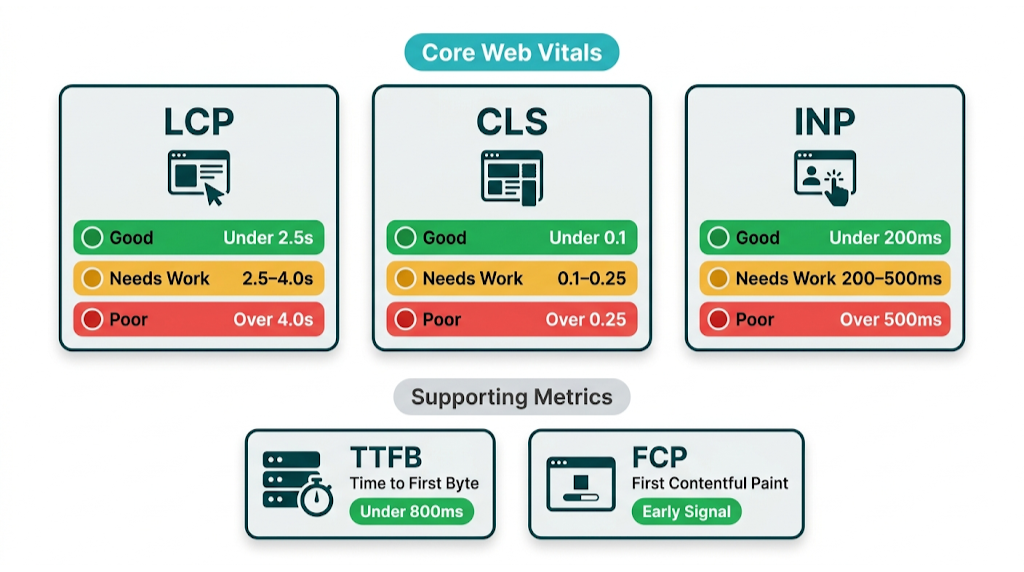
Core Web Vitals are Google's standardized set of user experience metrics that influence search rankings. They were introduced as ranking signals in the May 2021 Page Experience update and have been refined since. As of March 2024, the three active Core Web Vitals are Largest Contentful Paint (LCP), Cumulative Layout Shift (CLS), and Interaction to Next Paint (INP) - which replaced First Input Delay (FID) after Google determined INP better captures real-world interactivity. You can verify current thresholds and documentation at web.dev/vitals.
Core Web Vitals only help if you know what each metric measures, why it fails, and what usually causes the failure. That's the baseline for any page speed SEO strategy worth running.
Largest Contentful Paint (LCP) measures how long it takes for the largest visible content element on the page to finish rendering. This is usually a hero image, a large heading, or a video thumbnail. Google's threshold is:
- Good: under 2.5 seconds
- Needs Improvement: 2.5 to 4.0 seconds
- Poor: over 4.0 seconds
LCP is the Core Web Vital most tied to perceived load speed. Users judge speed based on when the main content shows up. A slow LCP - caused by unoptimized hero images, render-blocking resources, or slow server response - signals a poor experience before the user even starts reading.
Cumulative Layout Shift (CLS) measures visual stability - how much page content shifts during loading. A score of 0.1 or below is Good. Above 0.25 is Poor. CLS gets triggered by images without defined dimensions, ads that load after content, or web fonts that force text reflow. It isn't strictly a speed metric. It's in the set because layout shifts drive misclicks and make users lose their place.
Interaction to Next Paint (INP) is the newest addition, replacing FID in March 2024. FID only measured the delay before the browser begins processing a user's first interaction. INP measures the full response latency for all interactions across the page session - clicks, taps, and keyboard inputs. The thresholds are:
- Good: under 200 milliseconds
- Needs Improvement: 200 to 500 milliseconds
- Poor: over 500 milliseconds
INP failures usually come from heavy JavaScript tying up the main thread, an oversized DOM, or third-party scripts competing for processing time. These are harder to troubleshoot than LCP because you have to test interactions, not just initial load.
Core Web Vitals don't tell the whole story by themselves. Two additional metrics carry real diagnostic weight:
Time to First Byte (TTFB) measures how long the browser waits before receiving the first byte of data from the server. Google recommends under 800ms, with under 200ms considered excellent. A slow TTFB points to server-side problems - weak hosting, missing caching, slow database queries, or geographic distance between the server and the user. It often sits underneath a bad LCP.
First Contentful Paint (FCP) measures when the browser first renders any content - text, an image, or a background. It acts as an early signal for perceived speed and often correlates with LCP.
None of these metrics appear in a Cox internet speed test result. None of them improve when you upgrade your internet plan. They depend on how your website is built, hosted, and delivered. Tracking these alongside your broader SEO metrics to track gives you a complete picture of where your site stands.
How to Diagnose Slow Load Times: A Step-by-Step Audit Framework
Diagnosing page speed problems without a structured process leads to random fixes that don't move the needle. The framework below gives you a repeatable audit sequence that surfaces root causes, not symptoms, and produces output you can hand straight to a developer.
Step 1: Run PSI on your most important pages first
Don't start with your homepage and stop there. Run Google PageSpeed Insights on your top 10 organic landing pages - the ones driving the most traffic and conversions. Those pages carry the real cost of slow load times. Record both mobile and desktop scores, then flag which Core Web Vitals fail in the field data panel.
Step 2: Check CrUX data in Google Search Console
Google Search Console's Core Web Vitals report groups your pages into Good, Needs Improvement, and Poor buckets based on real CrUX field data. That gives you a site-wide view, not a one-page snapshot.
Site-wide patterns matter. If 60% of your URLs sit in the Poor bucket for LCP, treat it as a systemic issue - hosting, image delivery, or a site-wide render-blocking script - not a handful of "bad" pages.
Step 3: Run GTmetrix from multiple locations
Test the same URL from at least three different server locations: one close to your primary user base, one on the opposite coast or continent, and one international location if you have global traffic. Big score gaps between locations point to a CDN problem or single-region hosting. If scores stay bad everywhere, look server-side or in the code.
Step 4: Isolate the bottleneck category
Your PSI opportunities and GTmetrix waterfall data should point to a bottleneck category. Sort what you're seeing into one of these buckets:
- TTFB over 800ms - server/hosting problem
- LCP over 2.5s with fast TTFB - image issue or render-blocking resource
- High CLS - layout instability from images, ads, or fonts
- High INP - JavaScript execution problem
- Large page weight - uncompressed assets and unoptimized images
Step 5: Reproduce the problem in WebPageTest
Once you've tagged the bottleneck, reproduce it in WebPageTest on a throttled mobile connection. Use Moto G4 on 4G, which is Google's standard simulation. Run three consecutive tests and compare the filmstrip views.
That comparison is the point. It gives your dev team a clean reproduction case with request-level detail, not a vague "this page feels slow" report.
Step 6: Build your developer brief
Document every issue with the metric it affects, the specific resource or element causing it, the estimated improvement from fixing it (PSI shows this in its opportunities section), and the priority level based on ranking impact.
That developer brief is what turns an audit into shipped work. We'll cover the full developer brief format in the action plan section at the end of this article.
Reading a Waterfall Chart: What the Cascade of Requests Reveals About Your Site
A waterfall chart is the most diagnostic view available in GTmetrix and WebPageTest. It shows every HTTP request the browser makes to load a page, displayed as horizontal bars on a timeline. Each bar represents one resource - an HTML file, a CSS stylesheet, a JavaScript file, an image, a font, a third-party script.
Timing lives in the details. The length of the bar shows how long that request took, and the colour coding shows which phase consumed the time: DNS lookup, connection, SSL, waiting (TTFB), and content download.
Reading a waterfall reveals problems that aggregate scores hide. A page with a 4-second load time might spend 3.8 seconds on a single render-blocking JavaScript file that loads in the <head> and prevents anything else from rendering. Another page might trigger 40 image requests; each one is small, but together they create a queue that drags out LCP. Or you'll see a third-party chat widget fire 12 sequential API calls before the page becomes interactive.
The key patterns to look for in a waterfall:
- Long bars early in the cascade - render-blocking resources that prevent parallel loading
- A "staircase" pattern - sequential loading instead of parallel loading, often from JavaScript that injects additional scripts
- Thin bars that start late - deferred resources loading the way they should
- Third-party domains mid-cascade - external scripts that delay your own content
The waterfall is the document you send to a developer. It names the exact files causing problems and shows the precise milliseconds each one costs.
The Most Common Causes of Slow Page Speed (And How to Fix Each One)
Most slow websites fail for predictable, fixable reasons. The causes below drive the bulk of Core Web Vitals failures we see across client sites. Each one maps to a specific fix.
Render-blocking JavaScript and CSS
If a browser hits a <script> tag in the <head> without async or defer, it pauses rendering. It has to download the script, run it, then go back to building the page. That pause hurts.
One render-blocking script can add 1-2 seconds to LCP. Fix it by adding defer to non-critical scripts, moving scripts to the bottom of the <body>, and inlining only critical CSS above the fold.
Slow server response time (TTFB)
A TTFB over 800ms points to hosting or caching. Shared hosting with hundreds of sites on one server, missing page caching, slow database queries, and physical distance from users all stack up fast.
That same hosting-and-caching mix is where the fixes live: upgrade to a VPS or managed WordPress host, add full-page caching with Redis, Varnish, or a plugin like WP Rocket for WordPress, and deploy a CDN so content serves from edge locations closer to users.
Unoptimized third-party scripts
Every tag you add costs something: extra HTTP requests, more JavaScript to execute, and more network calls after the page loads. Google Analytics, Facebook Pixel, Intercom, Hotjar, Drift - all of it adds up.
A mid-market SaaS team spending $3k/month on MarTech tools might have 15-20 third-party scripts firing on every page. Those scripts fight for main thread time and push INP in the wrong direction. Audit your tag manager, cut anything unused, load non-critical scripts with async, and use a facade pattern for heavy embeds like chat widgets. These same performance principles apply when you're creating effective SEO content - a fast, well-structured page amplifies the value of every piece you publish.
No browser caching
Without cache-control headers, returning visitors re-download the same assets on every visit. That's wasted time and bandwidth.
Set long cache lifetimes - 1 year for versioned static assets - so repeat visitors pull from local cache instead of fetching CSS, JavaScript, and images again. That boosts performance for your most engaged audience. The same audience that converts.
Excessive DOM size
Google recommends keeping DOM nodes below 1,400. Pages with 3,000+ DOM nodes - common on complex WordPress themes with nested shortcodes and page builders - force the browser to do more work, and INP pays the price.
This one usually needs a developer in the templates. Audit the structure, then replace page builder output with cleaner custom HTML where it matters most.
Image Optimisation: The Single Biggest Quick Win for Most Slow Websites
Images usually drive the bulk of page weight. And unoptimized images are a top cause of poor LCP scores.
This category also gives fast, measurable gains once you fix it.
The core image optimisation checklist:
- Convert to next-gen formats - WebP delivers 25-35% smaller files than JPEG at equivalent quality. AVIF delivers 50% smaller files but has slightly lower browser support. Use the
<picture>element to serve WebP with a JPEG fallback. - Compress before upload - Squoosh, TinyPNG, or Cloudflare Images get file size down without visible quality loss. We routinely see a 3MB hero image drop to 180KB, which changes load time immediately.
- Set explicit width and height attributes - Missing dimensions trigger layout shifts (CLS) as the browser recalculates space during load. Define
widthandheightin your HTML. - Implement lazy loading - Add
loading="lazy"to images below the fold so the browser waits until the user scrolls closer. - Preload the LCP image - Preload the hero image (or the largest above-the-fold image) with
<link rel="preload" as="image">in the<head>. That tells the browser to fetch it early, not halfway through parsing. - Use responsive images - Use
srcsetto serve the right size per device. Sending a 2000px image to a mobile screen with a 390px viewport wastes bandwidth and inflates LCP.
One pass of image optimisation on a content-heavy site can cut page weight by 40-60% and improve LCP by 1-2 seconds. For most sites, it's the highest-ROI technical SEO task on the list.
Page Speed and SEO: How Slow Load Times Damage Rankings, Traffic, and Conversions
Page speed hits SEO through two channels: direct ranking signals and indirect user behaviour signals. Both matter. They compound.
The direct channel runs through Google's Page Experience ranking system. Core Web Vitals are confirmed ranking factors. Google has said pages with good Core Web Vitals scores can get a ranking boost as a tiebreaker when other signals are equal. In competitive SERPs where multiple pages have strong content and high authority backlinks, page experience often separates the winners from the pack. If your site fails LCP and INP while a competitor passes all three Core Web Vitals, you're starting from behind. Content optimisation won't erase that gap.
That gap gets wider through user behaviour. Slow pages increase bounce rate, reduce session depth, and cut conversion rates - and those outcomes feed into how Google judges page quality over time. Google's own research found that when page load time rises from 1 second to 3 seconds, the probability of a mobile user bouncing increases by 32%. Move from 1 second to 5 seconds and that probability jumps 90%. At a 5-second mobile load time, you're losing nearly half your mobile visitors before they read a single word.
Conversions take the same hit. Deloitte's research found that a 0.1-second improvement in mobile site speed increased conversion rates by 8.4% for retail sites and 10.1% for travel sites. Put that into revenue terms: a site generating $500k/year that gets a 10% conversion lift from speed optimisation alone adds $50k in revenue. And it comes from a one-time technical project.
Speed also controls crawl budget. Googlebot has a limited crawl budget for each site, driven by crawl rate limits and the site's crawl demand. Slow server response times (high TTFB) mean Googlebot crawls fewer pages per session. On large sites with thousands of URLs, that shows up fast: key pages get crawled less often, and new content sits longer before it gets indexed. Speed optimisation isn't only a ranking factor - it's an indexation efficiency factor. Understanding crawl budget optimisation in full helps you see why server performance and page speed sit at the heart of technical SEO. Moz's overview of page speed as a ranking factor reinforces this point: a slow site doesn't just hurt rankings directly - it reduces the number of pages search engines can crawl within their allocated budget.
How to Test Page Speed Accurately: Avoiding the Mistakes That Skew Your Results
Most site owners test page speed the wrong way, then make decisions off noisy data. The Oncrawl guide on running speed tests correctly calls out several repeatable errors that create false positives and false negatives. Fix the testing process first. Tool choice comes second.
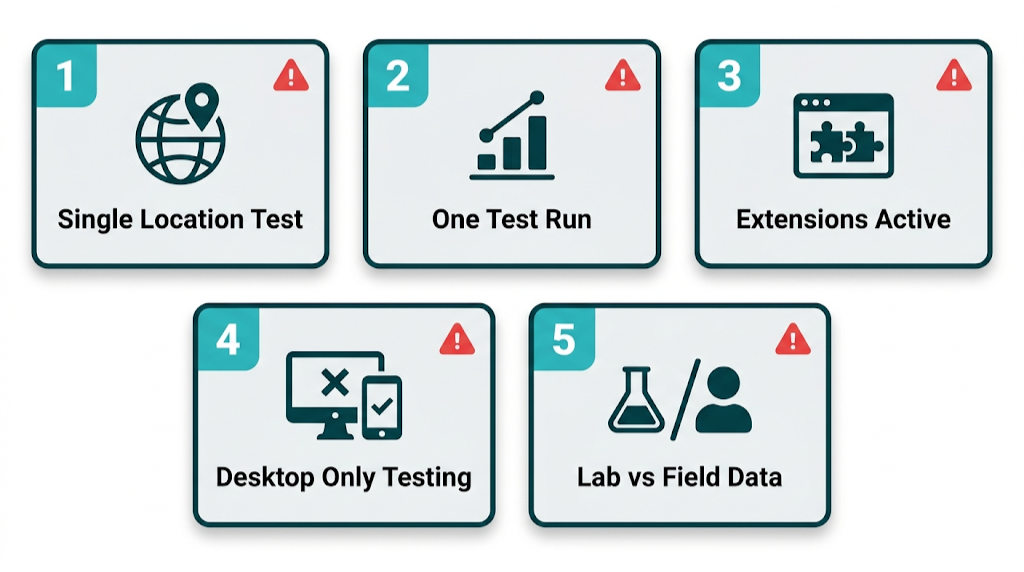
Mistake 1: Testing from a single location
Your server sits in one place. Your users don't. If you only test from a location near your host, you'll see results that look faster than what real users get. Test from at least three geographically distributed locations. A site hosted in Virginia might score 1.8s LCP from a New York test server and 4.2s LCP from a London test server - a gap that only a CDN can close.
Mistake 2: Running a single test and trusting the result
Server response times fluctuate with load, caching state, and network conditions. One run can mislead. Run at least three consecutive tests and take the median. WebPageTest supports multi-run testing out of the box. GTmetrix Pro supports scheduled repeated testing so you can track trends instead of snapshots.
Mistake 3: Testing with browser extensions active
Extensions change requests. Sometimes a lot. Ad blockers, password managers, SEO toolbars, and similar add-ons can shift load times in either direction. Ad blockers make pages look faster by blocking third-party scripts. Extensions that inject content slow things down by adding work. Test in a clean browser profile or incognito mode with extensions disabled.
Mistake 4: Ignoring the mobile/desktop distinction
Google indexes the mobile version of your site. Desktop-only testing misses what Google and most users see. Mobile performance often runs 30-50% worse than desktop because devices have less processing headroom and connections get throttled. Run mobile tests first. Use desktop runs as supporting context.
Mistake 5: Treating lab scores as field data
A PSI lab score of 90 doesn't mean you're passing Core Web Vitals in real usage. Lab tests run under controlled conditions. Real users show up with different devices, connections, browser states, and locations. Check the field data panel in PSI and the Core Web Vitals report in Search Console before you call performance "good." Pairing this with regular SEO reporting keeps performance data in context alongside your broader ranking and traffic trends.
Frequently Asked Questions About Speed Testing and Page Performance
What is the difference between a Cox speed test and a website speed test?
A Cox speed test measures the bandwidth between your device and Cox's network infrastructure - download speed, upload speed, and latency. It shows whether your internet plan delivers the speeds you're paying for.
A website speed test measures how quickly your site files download, parse, and render in a browser. Those tests measure different systems. A fast Cox connection still won't guarantee a fast site, because page load time depends on your server, your code, your images, and your CDN - none of which Cox controls.
Does page speed affect Google search rankings?
Yes. Core Web Vitals - Largest Contentful Paint, Cumulative Layout Shift, and Interaction to Next Paint - are confirmed Google ranking signals as part of the Page Experience update. Google uses these metrics as a tiebreaker in competitive SERPs.
Speed also shows up in behavior. Slow pages lift bounce rates and cut engagement, and that feeds back into how Google assesses page quality. Put together, page speed is one of the best technical SEO investments we can make because it hits rankings and conversion at the same time.
What is a good Google PageSpeed Insights score?
Google categorizes PageSpeed Insights scores as Good (90-100), Needs Improvement (50-89), or Poor (0-49). For competitive SEO, 90+ on mobile is the target.
Still, the score matters less than the Core Web Vitals field data. A page with a lab score of 85 that passes all three Core Web Vitals in field data is in better shape than a page with a lab score of 92 that fails LCP in real user data. Prioritize the field data panel over the aggregate score.
What is a good TTFB (Time to First Byte) for SEO?
Google recommends a TTFB under 800ms, with under 200ms considered excellent. TTFB is the first link in the page load chain - a slow TTFB delays every metric after it, including LCP.
If TTFB exceeds 800ms, start with hosting. Shared hosting causes a lot of these problems. Next, confirm full-page caching runs. Then decide whether a CDN will cut geographic latency for your user base.
What are Core Web Vitals and why do they matter for SEO?
Core Web Vitals are Google's three standardized metrics for measuring real-world user experience: Largest Contentful Paint (loading performance, threshold: under 2.5s), Cumulative Layout Shift (visual stability, threshold: under 0.1), and Interaction to Next Paint (interactivity, threshold: under 200ms). INP replaced First Input Delay in March 2024.
They matter for SEO because Google uses them as ranking signals in the Page Experience system. They also track closely with bounce rate, conversion rate, and session depth - user signals that influence rankings through quality and engagement.
Your Page Speed Action Plan: From Diagnosis to Developer Brief in 5 Steps
Finding what's wrong with page speed is half the work. The other half is turning diagnostic data into a brief a developer can ship against, with priorities set by ranking impact (not what feels easiest to fix). This five-step process takes us from a blank audit to a developer-ready document.
Step 1: Establish your baseline
Before we touch anything, we document the current state. Run Google PageSpeed Insights on your top 10 organic landing pages and record:
- Mobile and desktop performance scores
- LCP, CLS, and INP values from field data (if available)
- TTFB from WebPageTest
- Total page weight from GTmetrix
- Number of HTTP requests
Store this in a spreadsheet. Baselines matter.
Without a before state, we can't prove ROI to clients or stakeholders, and we can't separate real improvements from normal score variance.
Step 2: Categorize issues by fix type
That baseline turns into a fix list. Group every PSI opportunity and GTmetrix finding into one of four categories:
Category | Examples | Who Fixes It |
|---|---|---|
Server/hosting | High TTFB, no caching, no CDN | DevOps / Hosting config |
Code-level | Render-blocking JS/CSS, DOM size | Frontend developer |
Asset delivery | Unoptimized images, no lazy load, no WebP | Developer or content team |
Third-party | Unused scripts, heavy tag manager setup | Marketing + developer |
The category decides who owns the work and what the brief needs to look like. A server-side fix brief reads nothing like an image optimisation brief, even if both show up in the same PSI report.
Step 3: Prioritize by Core Web Vitals impact
Core Web Vitals impact drives the order. Not every PSI opportunity moves rankings at the same rate, so we prioritize fixes like this:
- LCP improvements - ties to the most visible ranking signal. Fix TTFB, preload the LCP image, compress hero images, remove render-blocking resources above the fold.
- INP improvements - JavaScript-heavy work that takes dev time but protects interactivity.
- CLS improvements - quick wins around image dimensions and font loading strategy.
- Remaining opportunities - unused CSS, legacy JavaScript, over-specified fonts, and other efficiency work that lifts scores but doesn't move Core Web Vitals first.
The PSI opportunities section estimates potential savings for each fix in seconds. Use that to rank work inside each category. A fix that saves 1.8s from LCP outranks a fix that saves 0.3s from FCP.
Step 4: Write the developer brief
That priority list needs to ship as a brief. Each issue should follow this structure:
- Issue: What is the problem (e.g., "Hero image on /services/ is 2.4MB JPEG, not compressed or converted to WebP")
- Metric affected: Which Core Web Vital or diagnostic metric it impacts (e.g., "LCP - currently 4.1s, field data Poor")
- Estimated improvement: The PSI-estimated saving (e.g., "PSI estimates 1.6s saving from image optimisation")
- Reproduction: How to see the problem (e.g., "GTmetrix waterfall, request #4 - 2.4s download bar")
- Recommended fix: Specific technical action (e.g., "Convert to WebP, compress to under 150KB, add
loading="eager"and<link rel="preload">in<head>") - Priority: High/Medium/Low based on Core Web Vitals impact
This format removes ambiguity. Developers shouldn't have to interpret "make images smaller." They get the file, the metric, the target, and the method.
Step 5: Validate and re-test
Validation keeps the work honest. After each batch of fixes, re-run your full baseline test sequence.
Don't wait until every fix ships - test after each category of changes so we can isolate impact by fix type. That matters for two reasons. First, it confirms the change worked. Second, it gives us clean reporting for clients or leadership: "Image optimisation alone moved mobile LCP from 4.1s to 2.3s, taking it from Poor to Good in field data."
Core Web Vitals field data needs time. Allow 28 days after implementation before checking Search Console, because CrUX data runs on a 28-day rolling average - changes won't show up right away. Lab data in PSI updates right away, but field data reflects that rolling window of real user visits. Set a calendar reminder to check Search Console four weeks after each major fix batch.
That full cycle - baseline, categorize, prioritize, brief, implement, validate - takes 6-10 weeks for a mid-size site with multiple issue categories. For a focused single-issue fix (say, a CDN deployment to address TTFB and geographic latency), we can move from diagnosis to validated improvement in under two weeks.
Page speed optimisation isn't a one-time project. It's an ongoing programme.
New content adds new images. New marketing tools add new scripts. Platform updates change render behaviour. Build a quarterly speed audit into your SEO calendar, and the site keeps its edge while competitors rack up technical debt. The gap between a site that treats performance as a programme and one that treats it as a one-off project compounds over 12-24 months into a real ranking and conversion advantage. Pairing that technical foundation with strong link building for SEO is what turns a well-optimized site into one that consistently outranks the competition.
Start with the Cox speed test if we need to confirm the connection is healthy. Then close it, open PageSpeed Insights, and work the metrics that move rankings.
related Blog Posts
.png)


Join 2,600+ Businesses Growing with Rhino Rank
Sign Up
Stay ahead of the SEO curve
Get the latest link building strategies, SEO tips and industry insights delivered straight to your inbox.