 Back to all posts

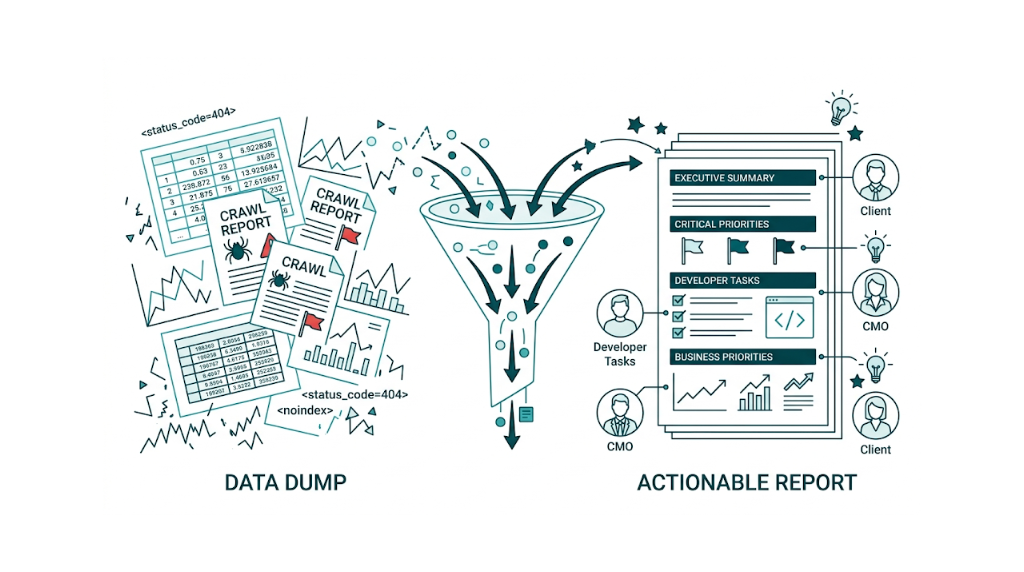
Running a technical SEO audit is the easy part. Tools like Screaming Frog, Semrush, and Google Search Console surface hundreds of issues within hours. The hard part is turning that data into a document that a CMO will read, a developer will act on, and a client will approve budget against. Most SEO professionals skip this step, hand over raw crawl exports or tool-generated PDFs, then wonder why nothing gets fixed.
The bottom line: A technical SEO audit report is a structured communication document, not a data dump. The best reports use a six-section framework covering executive summary, crawlability, Core Web Vitals, on-page technical issues, prioritisation, and next steps. They translate findings into business impact, map issues to an effort-impact matrix, and speak to multiple audiences at once. This article shows you exactly how to build that report, with templates, examples, and a priority matrix you can use immediately.
That translation is where most technical SEO work stalls. The gap between "we found 200 issues" and "here is what to fix first and why it matters to revenue" is where momentum dies. Developers need tickets, not bullet lists. CMOs need revenue framing, not crawl error counts. Clients need confidence their investment will produce a measurable result. Get the translation right and the audit turns into shipped fixes.
What a Technical SEO Audit Report Actually Is (and What It Isn't)
A technical SEO audit report is a structured deliverable that documents the technical health of a website, explains the business impact of each issue category, and provides a prioritised action plan for remediation. That last part matters most. Without prioritisation, you have a list. With it, you have a plan.
A plan is not a tool export. SEOptimer, Seomator, and similar platforms produce automated reports that flag issues by severity. Those outputs are a useful starting point for an audit, but they are not the report itself. An automated tool cannot tell your client why 47 redirect chains on their product pages suppress conversion-driving URLs. It cannot tie a failing Largest Contentful Paint score to a 12% bounce rate increase on mobile. The report supplies that layer: context, impact, and what to do about it.
The report also isn't a full SEO audit. A full SEO audit covers technical health, content quality, on-page optimisation, and backlink profile. A technical SEO audit focuses on the infrastructure layer: crawlability, indexation, site speed, HTTPS, structured data, and page experience signals. Scope drives audience. A full SEO audit speaks to content teams and link builders. A technical audit report speaks to developers and engineering leads first, then to marketing directors and CMOs who control implementation budget.
Treat the report like a briefing document, not a findings log. For every reader, cover three things: the current state, why it matters to the business, and what happens next. Build each section around those three points and the document starts driving decisions instead of sitting in a folder. If you're unsure where technical issues end and broader SEO problems begin, our technical SEO checklist can help you draw that line before you start.
The briefing document is the output. The audit process is not. The process stays internal and tool-heavy, and it changes as you iterate. The report stays client-facing, structured, and written for the people who have to approve work or ship it. Mixing those up is the fastest way to lose stakeholder buy-in.
Why Most Technical SEO Audit Reports Fail to Drive Action
Across agency and in-house environments, most technical SEO audit reports fail for one reason: they weren't written to drive action.
The most common failure mode is data without context. A report that lists 312 pages with missing meta descriptions, 89 broken internal links, and 14 crawl errors tells a developer what the tools found. It tells a CMO very little. Without business context, revenue framing, and a clear call on what matters most, the report sits in a shared drive and collects dust. Industry surveys call this out directly: in-house SEOs cite limited resources and unclear prioritisation as the main reasons technical fixes stall after an audit.
Unclear prioritisation shows up again in the second failure mode: audience mismatch. A single SEO audit written for one imagined reader fails part of the room. Developers need specificity: affected pages, HTTP status codes, the exact directives in robots.txt, and clear acceptance criteria for each fix. CMOs and marketing directors need impact framing: the cost in organic traffic and the upside from fixing it. One document can serve both, but only if the structure forces clarity instead of piling on more screenshots.
Structure only works if the report includes a prioritisation method. That brings us to the third failure mode: no prioritisation framework. Semrush's technical SEO audit guide categorises issues by error, warning, and notice, which works as a starting taxonomy. But even inside "errors," weight varies. A 404 on a page with zero backlinks and 12 monthly visits is not the same as a 404 on a page with 200 referring domains and 8,000 monthly visits. Treating them the same wastes developer cycles and delays meaningful organic gains. Understanding link equity fundamentals helps you make that call accurately when backlink-weighted pages are involved.
Meaningful gains also depend on current standards, and the fourth failure mode is outdated technical references. Several widely-read audit guides still list First Input Delay (FID) as a Core Web Vital. Google retired FID in March 2024 and replaced it with Interaction to Next Paint (INP). Reporting FID in a 2025 technical SEO audit report tells technical stakeholders the work is dated. Credibility takes a hit, and it doesn't need to.
The last failure mode is simple: no clear next step. A solid technical audit report ends with an action plan that assigns owners, sets timelines, and defines how success gets measured. Without that, even a well-structured report becomes a reference doc instead of a driver for change.
The Six-Section Structure Every Technical SEO Audit Report Needs
Every professional technical SEO audit report should follow a consistent six-section structure. Consistency sets expectations, makes the report easy to skim, and keeps high-impact issues from getting buried.
The six sections are:
- Executive Summary - business impact framing, top three to five priority issues, and a traffic/revenue implication where calculable
- Crawlability and Indexation - robots.txt, XML sitemap, crawl budget, and indexation status findings
- Page Experience and Core Web Vitals - LCP, CLS, and INP data with field and lab data distinguished
- On-Page Technical Issues - redirect chains, canonical errors, structured data failures, HTTPS status, and internal linking
- Priority Matrix - a 2x2 effort-impact grid mapping all findings to quadrants
- Action Plan and Next Steps - owner, timeline, and success metric for each prioritised fix
The order is deliberate. The executive summary comes first because stakeholders read page one and skim the rest. The action plan comes last because it pulls the report into a delivery plan. The priority matrix sits between findings and the action plan because it translates problems into work.
That translation only works if each section uses the same pattern: open with a one-paragraph summary, then show the evidence. A CMO can read the opening paragraph of each section and get the story in under five minutes. A developer can go straight to URLs, templates, and screenshots without wading through business framing.
The sections below break down how to write each of the four core findings sections in detail.
How to Write an Executive Summary That Non-Technical Stakeholders Will Read
The executive summary is the highest-leverage section in a technical SEO audit report. It also gets written last and, in most reports, it shows. Too many SEOs treat it like a contents recap. That misses the point.
A strong executive summary does four things. It describes overall technical health in plain language. It ranks the top three to five issues by business impact, not by a tool's severity label. It quantifies the upside where you can defend the math. And it sets the next step so the audit doesn't die in a doc.
Here is a worked example for a mid-market e-commerce site:
Executive Summary This audit covers 4,200 crawled pages across the site and identifies three critical issues affecting organic visibility. First, 340 product pages are excluded from Google's index due to a misconfigured noindex directive introduced during a platform migration in Q3. These pages collectively target high-intent commercial keywords and represent an estimated 18-22% of the site's potential organic traffic. Second, mobile LCP scores average 6.2 seconds against a target of 2.5 seconds, placing the site in the "Poor" threshold for 68% of mobile sessions. Third, 112 redirect chains of three or more hops are diluting PageRank to key category pages. Addressing the indexation issue alone is projected to recover meaningful organic visibility within 60-90 days of implementation.
Notice what this summary does not include: raw crawl error totals, a dump of every finding, or tool-first terminology. It leads with outcomes. It gives a timeline. It creates urgency without turning the report into a fire drill.
Keep the executive summary to one page maximum. One page. Max.
Use bold text for the three priority issues. Then write it last, once you've settled on what actually moves traffic, revenue, or both.
Documenting Crawlability and Indexation Issues With Evidence
Crawlability and indexation are the foundation of the audit. If Googlebot can't reach a URL, or it reaches it but doesn't index it, the rest of the report turns into theory. Google Search Central spells out the crawl and index pipeline as separate stages in its documentation, and the fix depends on which stage breaks.
That "which stage" call gets easier when you document crawlability at the URL level. Don't write "robots.txt is blocking important pages." Write this instead:
Finding: The robots.txt file atdomain.com/robots.txtcontains aDisallow: /products/directive that blocks Googlebot from crawling 1,847 product pages. This directive appears to be a legacy rule from the previous platform configuration. Google Search Console confirms that 0 of these pages appear in the Coverage report as indexed.
A URL-level entry gives developers something they can reproduce quickly, scope accurately, and fix without guesswork. It also gives stakeholders the business context in plain numbers: 1,847 product pages, not indexed.
For indexation reporting, use a structured table format:
Issue | Affected Pages | Priority | Estimated Traffic Impact |
|---|---|---|---|
Noindex directive on product pages | 340 | Critical | High |
Orphaned pages (no internal links) | 218 | Medium | Medium |
Duplicate pages without canonical | 94 | High | Medium |
XML sitemap includes 404 pages | 31 | Medium | Low |
Crawl depth exceeds 4 clicks | 156 | Low | Low |
The XML sitemap needs its own callout in this section because it sits right on the crawl-index line. A sitemap packed with redirected URLs, noindexed pages, or 404s sends mixed signals and burns crawl budget. Document sitemap status explicitly: total URLs listed, how many return 200, and how many still fail to index even though they appear in the sitemap.
Crawl budget gets hand-waved in a lot of audits, so treat it like a measurable constraint. For large sites with 10,000+ pages, pull crawl rate from Google Search Console's crawl stats report and compare it to the number of indexable URLs. A site with 50,000 pages and a daily crawl rate of 800 URLs has a crawl budget problem that slows discovery and delays indexing of new or updated content.
Crawl stats are only half the story, so cross-check tool crawls against Google Search Console. Gaps between Screaming Frog and GSC tend to surface the real issues: JavaScript rendering failures, conditional noindex tags, and server-side redirects that desktop crawlers miss. Our guide to common indexing issues covers the most frequent culprits and how to resolve them once you've identified the gap.
Reporting Core Web Vitals: LCP, CLS, and INP in Plain English
Core Web Vitals reporting is where a lot of technical audit reports lose credibility fast. Two mistakes cause most of the damage: treating lab data like field data, and still citing First Input Delay (FID) as a Core Web Vital.
Here's the current state. Google retired FID in March 2024 and replaced it with Interaction to Next Paint (INP). As of 2025, the three Core Web Vitals are Largest Contentful Paint (LCP), Cumulative Layout Shift (CLS), and INP. Any audit report still referencing FID is out of date. Per Google's Page Experience documentation, INP measures the latency of all interactions during a page session, not just the first, which makes it a better measure of real responsiveness.
That responsiveness context matters, but so does the market benchmark. HTTP Archive Web Almanac data shows that about 50% of websites failed Core Web Vitals on mobile as of late 2023. Use that number to frame client performance. A site with 55% of pages passing CWV on mobile sits below the median - it's not "fine," and it's not "acceptable."
Benchmarks only help if the data source is clean. When reporting Core Web Vitals, separate field data from lab data every time. Field data reflects real user experience from the Chrome User Experience Report, pulled through PageSpeed Insights or Google Search Console. Google uses field data for ranking. Lab data comes from Lighthouse and helps you diagnose what to fix. Mixing them confuses stakeholders and muddies the ranking conversation.
Structure your Core Web Vitals section like this:
Metric | Current Score (Field) | Target | Status | Primary Cause |
|---|---|---|---|---|
LCP | 6.2s | < 2.5s | Poor | Unoptimised hero image (487KB WebP) |
CLS | 0.08 | < 0.1 | Good | - |
INP | 340ms | < 200ms | Needs Improvement | Third-party script blocking main thread |
Primary cause is where the report earns its keep. For each metric outside the "Good" threshold, explain what the score means for users in plain English, then name the technical driver with enough detail that a developer can ticket it. Keep it specific.
For example: "LCP of 6.2 seconds means the main content of your page takes over six seconds to appear for most mobile users. The primary cause is a hero image loading without priority fetch directives, combined with render-blocking CSS." That lands with engineering. It also lands with a CMO.
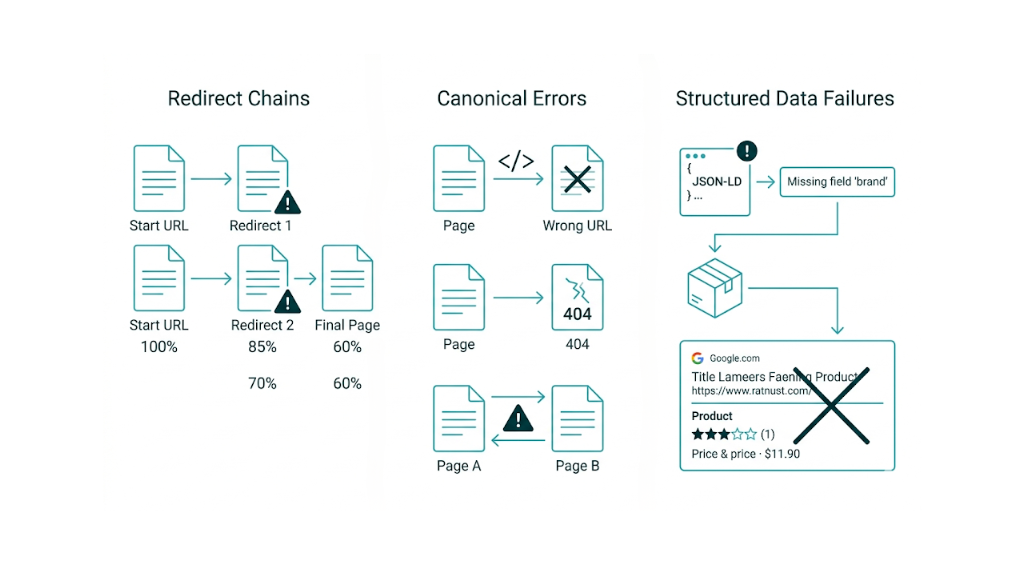
How to Present Redirect Chains, Canonical Errors, and Structured Data Failures
These three issue types get misrepresented in audit reports all the time. Some reports downplay them because they don't look dramatic in a crawl export. Others overplay them with jargon that turns non-developer readers off.
Redirect chains need to show the full chain, not just the start and end URLs. A three-hop chain from /old-page to /redirect-1 to /redirect-2 to /final-page bleeds PageRank at each hop and adds latency. Show the chain. Show how many referring domains point to the origin URL. Then quantify the PageRank dilution risk in relative terms. If 40 referring domains point to a URL that redirects through three hops before reaching the canonical destination, that's measurable link equity loss worth fixing.
That canonical destination brings us to canonical errors, which aren't one bucket in practice. Break them out by failure mode so the fix is obvious and dev tickets don't turn into back-and-forth.
- Self-referencing canonicals that point to a different URL than the page itself
- Canonicals pointing to noindexed pages
- Canonicals in conflict with hreflang tags
- Missing canonicals on paginated pages
- Canonicals pointing to redirected URLs
Each category needs a different fix. Labeling them all as "canonical issues" hides the remediation path and slows implementation.
Implementation is also where structured data failures get mishandled. Report them using Google's Rich Results Test output as proof. Call out the schema type, the exact validation error, and which rich result feature the site loses. On an e-commerce site, Product schema missing price or availability means no price rich results in SERPs. That hits click-through rate, and you can explain it in business terms without hand-waving. Per Google Search Central documentation, structured data that fails validation is ignored entirely for rich result eligibility, so treat this as pass/fail rather than "slightly worse performance." Understanding SERP features and their benefits helps you frame the business case for structured data fixes in terms stakeholders will act on.
How to Build a Priority Matrix That Gets Fixes Implemented
The priority matrix is the section that separates a professional technical SEO audit report from a tool export. It gives developers and marketing leads what they actually need: a clear order of operations for fixes.
That "fix first" call gets messy fast. The matrix keeps it simple.
The framework is a 2x2 grid with Impact on the vertical axis (Low to High) and Effort on the horizontal axis (Low to High). Every finding from the audit maps to one of four quadrants:
Low Effort | High Effort | |
|---|---|---|
High Impact | Quick Wins - fix immediately | Strategic Projects - plan and resource |
Low Impact | Backlog - fix when convenient | Deprioritise - review quarterly |
Real technical SEO work fits this model cleanly. Here are examples for each quadrant.
Quick Wins (High Impact, Low Effort)
- Fix robots.txt to unblock indexed product pages. One file edit, fast crawl impact.
- Add missing canonical tags to paginated pages (template-level fix, covers hundreds of pages)
- Correct the XML sitemap to remove 404 and redirected URLs
- Enable the HTTPS redirect for HTTP pages already on SSL
Strategic Projects (High Impact, High Effort)
- Resolve LCP issues tied to server response time (requires infrastructure changes)
- Implement structured data across 4,000+ product pages
- Flatten site architecture to reduce crawl depth below 4 clicks
- Migrate from a JavaScript-rendered site to server-side rendering for key landing pages
Backlog (Low Impact, Low Effort)
- Alt text on decorative images
- Fix orphaned pages with no traffic or backlinks
- Update meta descriptions on low-traffic blog posts
Deprioritise (Low Impact, High Effort)
- Resolve duplicate content across thin, low-traffic archive pages
- Implement hreflang for a single international market with minimal traffic
Effort scoring needs to reflect developer time, not SEO effort. A fix we can spec in 10 minutes might still take a developer 3 days to ship safely to production once code review, QA, and release windows get involved. Calibrate effort against the engineering team's real capacity and the deployment cycle the site runs on.
That effort calibration turns into a budget conversation for retainers. For a mid-market SaaS team spending $3k/month on an SEO retainer, quick wins defend the current spend, and strategic projects make the case for dedicated development time. The matrix makes that case in one glance.
Include a scoring table alongside the matrix for clients that want the method spelled out:
Issue | Impact Score (1-5) | Effort Score (1-5) | Priority Quadrant |
|---|---|---|---|
Unblock product pages in robots.txt | 5 | 1 | Quick Win |
Fix LCP on mobile | 5 | 4 | Strategic |
Resolve canonical conflicts | 4 | 2 | Quick Win |
Implement Product schema | 4 | 3 | Strategic |
Fix redirect chains | 3 | 2 | Quick Win |
Add alt text to images | 2 | 1 | Backlog |
Impact scoring should tie back to expected traffic or revenue movement. Effort scoring should tie to developer hours plus deployment risk. Once those scores are in place, the matrix assembles itself.
Technical SEO Audit Report Templates and Real-World Examples
Templates cut the time it takes to produce a consistent, professional report. But the best templates act as frameworks, not fill-in-the-blank docs. They lock in the structure and the questions each section must answer, while leaving room for the specifics that change from audit to audit.
That structure matters because it keeps stakeholders oriented. And it keeps the audit from turning into a pile of screenshots.
Here is a section-by-section template outline we can adapt right away:
Section 1: Executive Summary
- Site audited, date, auditor name
- Overall technical health score (use a consistent rating: Critical / Needs Improvement / Good)
- Top 3-5 priority issues with one-sentence business impact statement each
- Projected outcome of addressing priority issues (traffic recovery estimate, timeline)
Section 2: Crawlability and Indexation
- Total pages crawled vs. total pages indexed
- Robots.txt status and any blocking directives
- XML sitemap status (URL count, 200 vs. non-200 breakdown)
- Crawl depth distribution
- Key finding table (use the format shown in the crawlability section above)
Section 3: Core Web Vitals and Page Experience
- Field data vs. lab data distinction (state which source each metric comes from)
- LCP, CLS, and INP scores by device (mobile and desktop)
- Percentage of pages in Good / Needs Improvement / Poor threshold
- Primary causes per failing metric
- HTTPS status (all pages on HTTPS? Mixed content warnings?)
Section 4: On-Page Technical Issues
- Redirect chain count and worst examples (show the full chain)
- Canonical error breakdown by type
- Structured data: schema types present, validation errors, rich result eligibility
- Internal linking: orphaned pages, pages with excessive inbound internal links, link depth issues
Section 5: Priority Matrix
- 2x2 grid visual
- Scoring table with impact and effort scores
- Top 10 issues mapped to quadrants
Section 6: Action Plan
- Issue, recommended fix, owner (SEO / Dev / Design), timeline, success metric
- Example: "Fix robots.txt disallow directive | Remove
/products/from Disallow | Dev team | Sprint 1 | 340 product pages indexed within 60 days"
A real-world example makes the scaling clear. Take an enterprise e-commerce site with 80,000 product pages: a technical SEO audit report for that site will run 25-40 pages plus appendices, include a separate developer ticket template for each critical fix, and segment Core Web Vitals data by page template type (homepage, category, product, checkout) instead of relying on a single site-wide average. The executive summary still stays to one page. The action plan becomes a 90-day sprint roadmap.
That same six-section structure also works for smaller sites. A 10-15 page report still holds up, it just goes lighter on appendices and deeper notes. Depth scales with complexity. The structure stays constant, which is what makes the report defensible and the process repeatable.
For a technical SEO audit free starting point, we can use Google Search Console's Coverage, Core Web Vitals, and Enhancements reports to cover the foundation for sections two, three, and four at no cost. Pair that with a free Screaming Frog crawl up to 500 URLs and PageSpeed Insights, and there is enough data to produce a solid report for a small site without paid tooling. If you're working with a tighter budget, our roundup of SEO tools for small businesses covers the best free and low-cost options worth considering.
The Right Tools for Each Section of Your Technical SEO Audit Report
No single tool covers every section of a technical SEO audit report. Strong reports pull data from a few sources, then cross-check the overlaps so you catch the gaps a single crawl or dashboard won't show.
Here is how to match tools to report sections:
Report Section | Primary Tool | Secondary / Validation Tool |
|---|---|---|
Crawlability and Indexation | Screaming Frog | Google Search Console (Coverage report) |
Core Web Vitals (Field Data) | Google Search Console CWV report | PageSpeed Insights (CrUX data) |
Core Web Vitals (Lab Data) | PageSpeed Insights / Lighthouse | WebPageTest |
Redirect Chains | Screaming Frog | Sitebulb |
Canonical Errors | Screaming Frog | JetOctopus (for large sites) |
Structured Data | Google Rich Results Test | Schema Markup Validator |
Internal Linking | Screaming Frog | Semrush Site Audit |
Backlink-Weighted 404s | Ahrefs / Semrush | Google Search Console (404 report) |
HTTPS Status | Screaming Frog | SSL Labs (for certificate depth) |
Screaming Frog covers most crawl-based findings, so it should be the default starting point for a technical audit. Start there. Then scale up when the site demands it.
That scale point hits fast on big sites. Once you're dealing with sites above 100,000 pages, Sitebulb or JetOctopus tends to handle the volume better and returns cleaner output you can drop straight into report sections without fighting exports.
Google Search Console is non-negotiable. It gives you field data rather than a crawler's view, so you're looking at what Googlebot and real search visibility signals reflect, not what a desktop crawl infers. That field data is what stakeholders argue about, so it belongs in the report. The Coverage report, the Core Web Vitals report, and the Enhancements report for structured data feed directly into the audit. Our guide on using Google Search Console effectively walks through how to extract each of these reports in practice.
That audit still needs a clean issue inventory, and this is where Semrush's Site Audit fits. It produces an issue list with severity scoring, which works well as your starting classification before you apply your own priority matrix. The Semrush audit guide also gives you a workable way to bucket findings, and it's especially handy for internal linking and duplicate content callouts.
Core Web Vitals needs its own handling, because one dataset won't answer both engineering and risk questions. Use two sources every time: PageSpeed Insights for CrUX field data and Lighthouse for lab diagnostics. Keep them separate in the report and label them clearly. Dev teams need Lighthouse waterfall detail to chase LCP. Execs need CrUX percentages to judge ranking exposure.
Cross-checking becomes even more valuable on crawlability, and one comparison gets missed too often: Screaming Frog crawl data vs your XML sitemap. You'll surface issues that neither view shows alone: sitemap URLs returning non-200 status codes, crawlable URLs that never make it into the sitemap, and sitemap URLs carrying noindex. Those belong in the crawlability section, and they usually turn into clean, actionable tickets.
How Frequently Should You Produce a Technical SEO Audit Report?
Frequency depends on site size, rate of change, and the development team's deployment cadence. A single annual audit won't keep up with any site that ships updates. But monthly full audits waste time on stable builds that don't change much.
For most sites, the workable cadence is a quarterly full technical SEO audit report plus monthly monitoring of the key signals. The quarterly report runs all six sections end to end. The monthly check watches Core Web Vitals trends, crawl error movement, and indexation status, then flags anything that needs an out-of-cycle audit.
Out-of-cycle audits matter because releases break things. Certain events should trigger an immediate technical audit, even if you just shipped a quarterly report:
- Site migrations (platform change, domain change, HTTPS migration)
- Major CMS updates (WordPress core updates, theme changes, plugin additions)
- Significant traffic drops (more than 15% week-over-week organic decline)
- Google algorithm updates (particularly core updates and spam updates)
- Large-scale content changes (mass page deletions, URL restructuring, taxonomy changes)
That cadence should show up in the retainer for agency clients. A quarterly technical SEO audit report gives clients a concrete deliverable that proves ongoing value beyond link building and content production. It also sets a steady rhythm for planning conversations about where dev time goes next. If you're looking for a way to deliver this kind of ongoing technical oversight without expanding headcount, our managed service handles the full audit and implementation cycle for you.
Dev time is the constraint for in-house teams, too, but the report plays a different role. A quarterly audit creates the paper trail that backs up sprint allocation for SEO fixes, because it turns SEO work from hallway asks into documented priorities. With a report that includes a priority matrix and clear business impact framing, SEO fixes move into the backlog as formal tickets with acceptance criteria and outcomes you can measure.
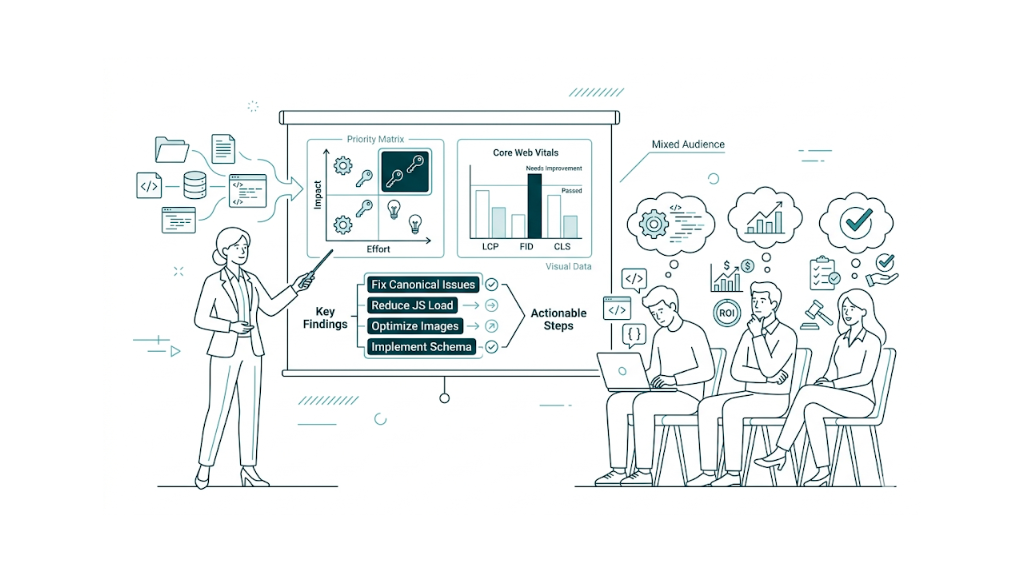
How to Present Your Technical SEO Audit Report to Clients or Stakeholders
Writing a great report is half the job. Presentation decides what gets built.
The first rule of presenting a technical SEO audit report: match the room. A session with a CTO and dev team runs differently from one with a CMO and marketing lead. Dev teams want technical depth, exact fixes, and acceptance criteria they can drop into tickets. Marketing stakeholders want business impact, risk, and a clear request for time or budget.
Mixed audiences need structure. That structure should mirror the report: open with the executive summary (business impact, top priorities, projected outcome), then give a high-level walk-through of the four findings sections, then spend most of the time on the priority matrix and action plan.
The detail stays in the report. The presentation sells the action plan.
Data should show, not tell. A bar chart that groups pages by Core Web Vitals threshold reads faster than a table of scores. A visual 2x2 priority matrix lands harder than a numbered list. Google Slides, Canva, or Notion make it easy to embed charts and matrices without design work.
That priority matrix also helps with framing. With clients, we position findings as opportunities, not failures. "Your competitors are averaging 2.8 second LCP on mobile and you're at 6.2 seconds, which means closing that gap is a competitive opportunity" lands better than "your site is slow." Same data. Better angle. Tracking key SEO metrics alongside your audit findings gives you the before-and-after benchmarks that make this competitive framing concrete.
End on an ask. "We recommend prioritising the three Quick Win fixes in Sprint 1, beginning with the robots.txt correction. We need 30 minutes with your lead developer to walk through the ticket specifications. Can we schedule that this week?" A concrete next step turns a meeting into work.
That next step needs a paper trail. Follow up within 24 hours with a written summary of agreed actions. The report is the reference document. The follow-up summary triggers delivery and keeps everyone aligned on owners and sequencing.
One final point: don't present every finding. Present what matters, then point to the report for the full list. Presenting 200 issues in a 60-minute meeting guarantees fatigue and decision paralysis. Presenting five priority issues with clear business impact and a specific ask gets implementation.
Frequently Asked Questions About Technical SEO Audit Reports
What should be included in a technical SEO audit report?
A complete technical SEO audit report should include six core sections: an executive summary with business impact framing, a crawlability and indexation analysis, a Core Web Vitals and page experience section covering LCP, CLS, and INP - not FID, which Google retired in March 2024, an on-page technical issues section covering redirects, canonicals, structured data, and HTTPS, a priority matrix mapping findings to effort and impact, and a specific action plan with owners, timelines, and success metrics. Each section should open with a plain-language summary before the detailed findings.
How do you structure a technical SEO audit report?
Structure your report with the executive summary first, findings sections in the middle, and the priority matrix and action plan at the end. Inside each findings section, start with a one-paragraph summary, then show evidence in tables where possible. Keep formatting consistent: bold for key terms and priority issues, tables for comparisons, and bullet lists for process steps or fix specs. The structure should let a CMO read only the opening paragraph of each section and still get the full picture, while a developer can drill into the detail they need.
What is the difference between a technical SEO audit and a full SEO audit report?
A technical SEO audit stays on the infrastructure layer of the site. It covers crawlability and indexation, site speed and Core Web Vitals, HTTPS, structured data, redirect chains, and canonical tags.
A full SEO audit includes that same technical work, then expands into content quality, on-page optimisation such as title tags, meta descriptions, and keyword targeting, plus backlink profile analysis. The audience shifts with the scope. Technical audit reports are written for developers and engineering leads first, and for marketing directors second. Full SEO audit reports land with a wider group that includes content strategists and link builders.
How long should a technical SEO audit report be?
Length scales with site complexity. For a small business site with under 500 pages, we keep the report to 8-12 pages. A mid-market site with 5,000-50,000 pages warrants 15-25 pages, because there are more templates, more crawl paths, and more edge cases to document. An enterprise site with 100,000+ pages often needs 30-50 pages, and that usually means appendices plus separate developer ticket templates so the main report doesn't turn into a wall of URLs.
The executive summary still needs to fit on a single page. That's the part that gets read.
Stakeholders who receive a 40-page report will read the executive summary and skim section headers. Structure accordingly.
How do you prioritise findings in a technical SEO audit report?
Use a 2x2 effort-impact matrix. We score each finding on impact from 1-5 based on estimated traffic or revenue effect, and on effort from 1-5 based on developer hours and deployment risk.
Then we sort issues into four buckets:
- High impact, low effort: Quick Wins. Fix these first.
- High impact, high effort: Strategic Projects that need planned resource allocation.
- Low impact, low effort: backlog items.
- Low impact, high effort: deprioritise them or cut them from the report.
Effort scoring only works if it reflects the real team. Calibrate effort against the actual development team's capacity and deployment cycle, not the SEO team's assumption of how "simple" a fix should be.
How do you present a technical SEO audit report to non-technical stakeholders?
Frame every finding in business terms first, then drop into the technical detail. Lead with impact: "340 product pages are not visible in Google search, representing an estimated 18-22% of potential organic traffic" rather than "noindex directives are present on product page templates." That impact-first framing keeps the discussion on risk and upside, not implementation trivia.
Use visual formats that match the decision being made. Bar charts work well for Core Web Vitals thresholds. A visual 2x2 matrix makes prioritisation obvious at a glance. Summary tables beat raw data exports every time, because stakeholders want the pattern, not the spreadsheet.
Limit the live presentation to the five most important findings and point everyone to the full report for details. End with a specific ask for resourcing or a next meeting so the work gets scheduled, not parked.
related Blog Posts


Join 2,600+ Businesses Growing with Rhino Rank
Sign Up
Stay ahead of the SEO curve
Get the latest link building strategies, SEO tips and industry insights delivered straight to your inbox.