
 Back to all posts
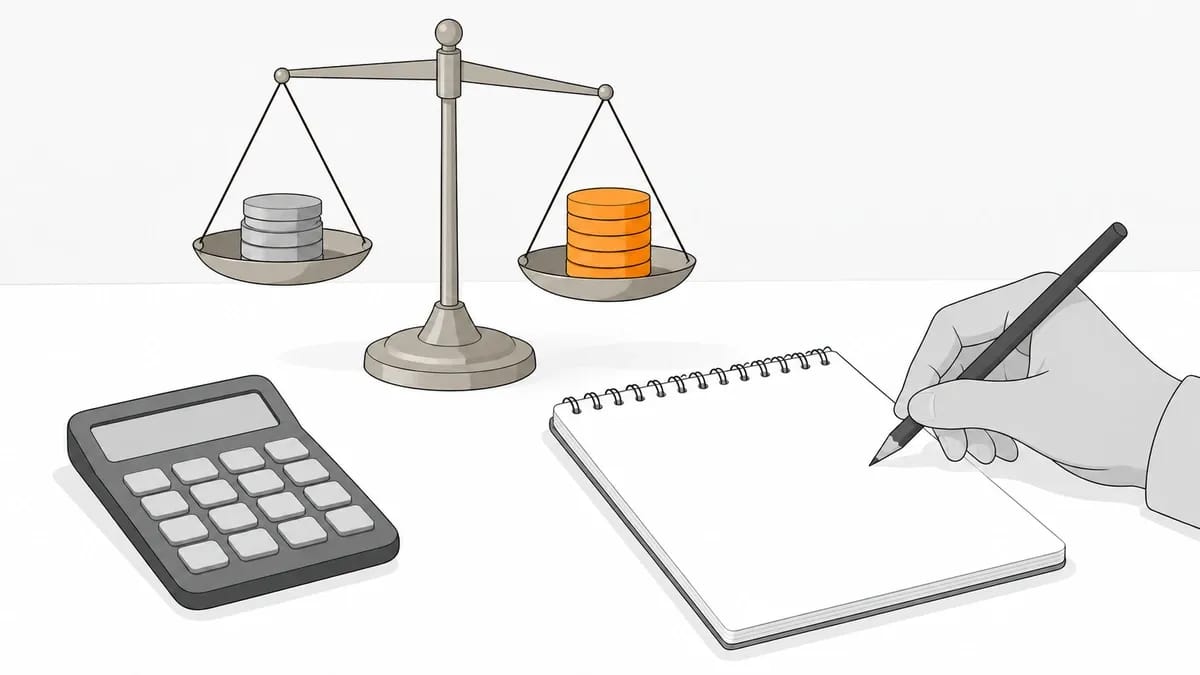
Link building ROI is the return a link campaign produced, less what it cost, divided by what it cost, written as a percentage. The sum is simple; the work is in the inputs: a baseline recorded before the first link goes live, a cost that counts everything the campaign consumed, and a return read from your own Search Console and Google Analytics over a window long enough for the links to have had an effect.
With those inputs, ROI from link building is measurable. This page is a working procedure for how to measure link building ROI, in the order the work happens. It gives the formula and where each input comes from, what to record before the first link goes live, what to read at each stage, two stand-ins for when revenue cannot be attributed, a worked example in which every input is an assumption, and what we report on a placement.
The link building ROI formula and where each input comes from
ROI = (return − cost) ÷ cost × 100
A return of twice the cost is an ROI of 100%, not "2x", and the percentage is kept throughout this page. The percentage lets campaigns of different sizes, and other channels costed on the same basis, sit side by side.
Return is the extra revenue produced by the pages the links point to, counted over the baseline those pages had before the campaign, not all revenue from search. It is read in two places. The clicks a page receives from Google Search come from the Performance report in Search Console, filtered to the target pages so the rest of the site does not dilute the count. Google's Search Console Help page on the Performance report defines the count: "Clicks: The number of times a user clicked your site from Google Search results." What those visits did after they arrived comes from Google Analytics 4, where the actions that count are set up as key events. Google's Analytics Help page on key events says: "A key event is an event that measures an action that's particularly important to the success of your business." Extra clicks, multiplied by the share of visits that complete a key event, multiplied by the value of one key event, is the return. Visits that arrive through the placed link itself are referral visits, counted on their own; tagging them is covered in tagging placed links.
Cost counts every invoice for placements or for a service, the cost of any content written for the campaign, the tool subscriptions used to plan and track it, and your own team's hours at an hourly rate. Leaving out the hours makes the ROI look better than it is. Use the same cost basis from one campaign to the next, or the two cannot be compared. What placements cost across the market is set out in what link building costs.
Window is the number of months over which the return is counted, and it is stated with the result. The window starts when the first link goes live, not when the order is placed. The same campaign gives a different figure at six months and at twelve, because the cost is spent early while the return builds over time, as the worked example below shows.
What to record before the first link goes live
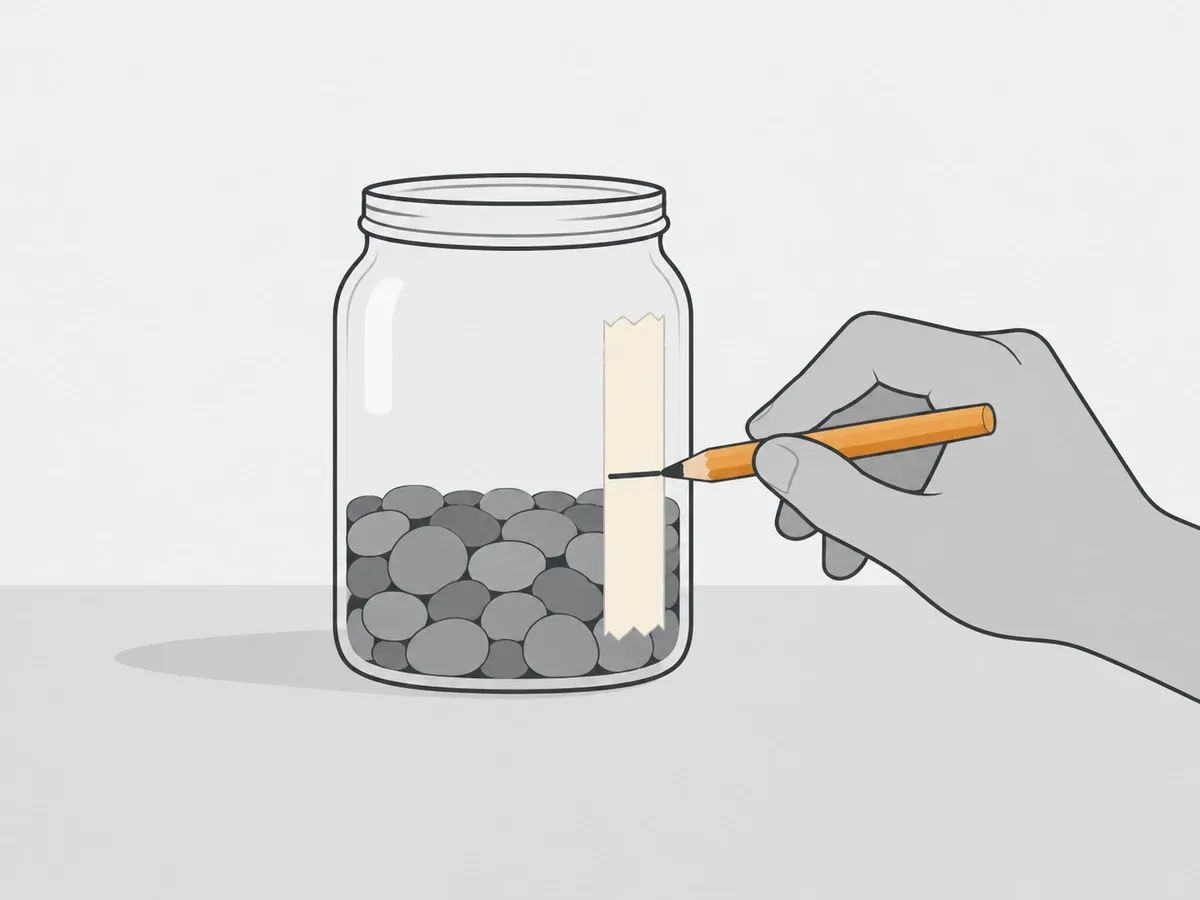
Every input on the return side of the formula is a difference: what the page does now against what it did before. Without a dated baseline there is nothing to subtract, so the extra clicks cannot be told apart from the clicks the page already had. Record the following for each target page, on one date, before the first link goes live, and keep the export.
What to record | Where it is read | The maker's own definition |
|---|---|---|
Clicks | Google Search Console, Performance report | Clicks: The number of times a user clicked your site from Google Search results. |
Impressions | Google Search Console, Performance report | Impressions: How many times your site appeared in Search results. |
CTR | Google Search Console, Performance report | CTR (click-through rate): The click count divided by the impression count. |
Average position | Google Search Console, Performance report | Average position: The average position of the topmost result from your site. |
Key events | Google Analytics 4 | A key event is an event that measures an action that's particularly important to the success of your business. |
Referring domains | Ahrefs Site Explorer, Referring domains report | Referring domains are domains from which the target website or web page has one or more backlinks. |
Organic traffic value | Ahrefs Site Explorer, Overview | Organic traffic value is the equivalent monthly cost of traffic from all keywords that the target website/URL ranks for organically, if that traffic was paid via PPC instead. |
The export matters because Google's Analytics Help page on connecting Search Console says: "Search Console keeps data for the last 16 months. As a result, reports in Analytics also include a maximum of 16 months of data." A campaign measured over a year needs its starting figures saved, because the report will not keep them for ever.
Each score as its maker defines it is in link building metrics. Why two tools give two different counts for the same site's links is in counting backlinks, and it is the reason the baseline names the tool each figure came from.
What to read at each stage
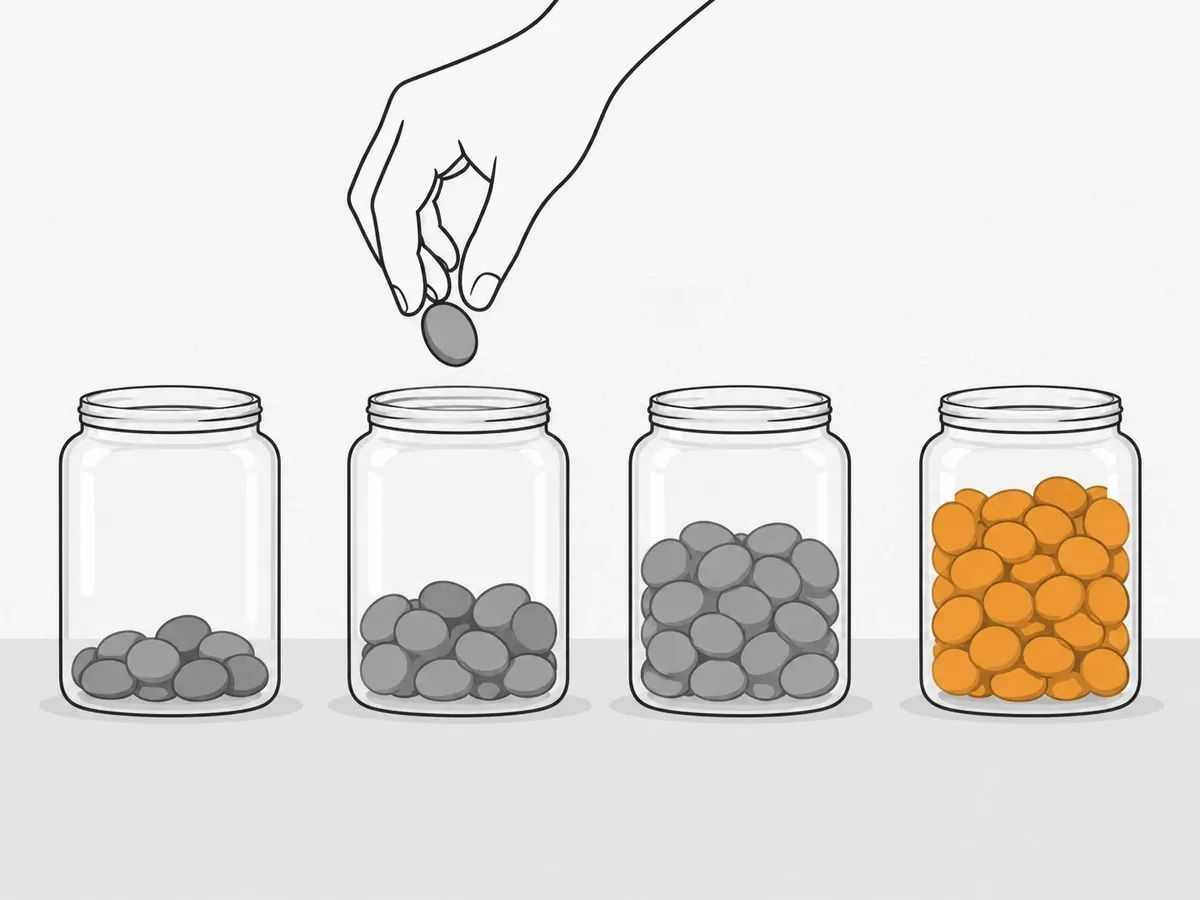
Tracking a link building campaign means reading four stages in order: three leading indicators, then the lagging one, key events and revenue.
First, that the link is live and found. A placed link is first a URL to check: the page is live, and the link sits where it should. After that, the link appears in a tool when the tool's crawler reaches the page. Ahrefs' help page on how long it takes to find a new backlink, dated 3 September 2026, says: "So the short answer is that it can take a few days up to some weeks before we crawl your new backlink." So the referring domains count is the one number in the baseline table that counts the link itself, and the date it changes is the tool's, not the link's.
Next, position for the target queries. Average position in the Performance report, for the queries the target page is meant to rank for, is read against the baseline. The sampled timing figure used here is old and small: Kristina Kledzik's post on Moz's blog, dated 21 April 2016, describes the sample: "I picked out 76 links pointing to pages which are all similar to each other in content, and we didn't change that content (significantly) for 6 months." Her finding: "It takes 10 weeks on average to see 1 rank jump", and her own caution: "Keep in mind that I am working with a fairly small data set, so I don't recommend that you promise a 10 spot jump after 22 weeks." It is 76 links to one company's pages, in 2016: a scale for patience, not a schedule to promise against. More dated evidence on timing, with each sample's size and method, is in how long link building takes to work.
Then clicks. Clicks follow position, and how many follow a given position depends on the results page for that query, as the next section's click-through figures show. Read clicks to the target pages against the baseline, month by month. Read impressions alongside them, since a page can be shown more often before it is clicked more often.
Last, key events and revenue. Only when clicks have moved is there anything new to count as return, and the key events completed by those extra visits are the number the formula uses. A report sent before clicks have moved can still say what has happened: the links are live, the tools have found them, position has or has not moved. What such a report cannot yet do is call any of it a return.
When revenue cannot be attributed: two stand-ins
Some sites cannot tie a sale to a search visit: the sale happens offline, or months later, or through another person. Two stand-ins are in common use for the return side of the formula, and each has a limit stated by its own maker. Neither is revenue, and a report that uses one should say which one it uses.
The first stand-in is organic traffic value in Ahrefs Site Explorer, defined in the baseline table above. Ahrefs' help page on Traffic value, dated 3 September 2026, says how the figure is made: "We calculate it based on multiplying the monthly organic traffic of each keyword at it's respective ranking position, by their CPC value." The traffic figure inside that multiplication is itself an estimate, and Ahrefs' help page on organic traffic, dated the same day, says so: "NOTE: Remember to treat the organic traffic estimations in Ahrefs as precisely that: estimations." So a rise in organic traffic value is an estimate built on an estimate: useful as a trend line for the same page over time, read against the page's own baseline, and not a revenue figure.
The second stand-in is modelled clicks from a position change: multiply a query's monthly searches by a click-through rate for the new position and by a rate for the old one, and take the difference. The rate is the weak input, because a click-through rate is not a fixed property of a position. Advanced Web Ranking's study of organic CTR by position, a July 2026 snapshot on a page dated 14 September 2026, drawn from more than 1.75 million US results pages a month across desktop and mobile, reports for its desktop pages (Google US desktop, all types of results page) a click-through rate of 20.02% at position 1, 10.36% at position 2 and 3.89% at position 3. The same page says: "The average #1 position lost roughly a quarter of its clicks in a year: 20.9% average CTR over the last 12 months versus 28.0% the 12 months before (US, all devices)." Sille Christensen of AccuRanker, a rank tracking company, wrote on 2 June 2026 in AccuRanker's piece on CTR models: "the CTR for rank 1 can vary from 0% to 75% because the SERP layout can push organic search results up and down the page". A forecast built on one fixed rate should say which rate, whose and from when; your own Search Console click-through rate for the query is the better input where you have it.
A worked example, with every input an assumption
The figures below are made up to show the sum; none is a result, a price or a forecast.
- Cost. Six months of placements at $1,000 a month, plus five hours a month of your own time at $40 an hour, is $1,200 a month and $7,200 in all.
- Baseline. The target pages had 400 clicks a month from Google Search before the first link, recorded in Search Console.
- Extra clicks. Over the twelve months from the first link, the same pages had 3,000 more clicks than twelve months at the baseline would have given.
- Return. 2% of visits complete a key event and one key event is worth $150, so 3,000 clicks give 60 key events and $9,000.
- ROI. ($9,000 − $7,200) ÷ $7,200 × 100 = 25%.
Read at month six instead, when the extra clicks so far total 600, the same campaign shows 12 key events, $1,800 and an ROI of −75%, with the whole cost counted and most of the extra clicks still to come. Nothing about the campaign differs between the two readings except the date. That is why the window is stated with the figure, and why one reading taken early describes the calendar, not the campaign.
What we report on a placement
You supply the target URL and the anchor text when you order. Before a placement goes out we check the HTTP status code the target URL returns. After publication we check that the page is live, that the link sits in the body copy, that the anchor text and target URL match the order and that the page is indexable. Only then is the URL reported to the dashboard, where every live URL is listed and can be exported as an unbranded file. The full standard is on our quality assurance page.
We use two indexing services as standard for all clients, and between them we see an indexing rate of roughly 95%; without a service, indexing can take up to 4 weeks. Every delivered link has 12-month replacement cover: if the link or its page is removed in that time, we replace it like for like. On the Managed Service, reporting is monthly and white-label. What we report is the placement: the live URL and its checks. The return is read in your own Search Console and Analytics, by the steps above.
Frequently asked questions
How do you calculate link building ROI?
Link building ROI is calculated as the return minus the cost, divided by the cost, multiplied by 100, and written as a percentage. The return is the extra revenue the linked pages produced over their recorded baseline: extra clicks from Google Search, multiplied by the share of visits that complete a key event in Google Analytics 4, multiplied by the value of one key event. The cost counts every invoice for placements or a service, content written for the campaign, tool subscriptions and the team's own hours at an hourly rate. A return of twice the cost is an ROI of 100%.
How do you measure a link building campaign's ROI without revenue data?
A link building campaign's ROI can be measured without revenue data by using one of two stand-ins for the return. The first is organic traffic value in Ahrefs, which prices a page's estimated organic traffic at its pay-per-click cost; its limit is that the traffic figure inside it is an estimate, so the value is an estimate built on an estimate. The second is clicks modelled from a position change, multiplying a query's monthly searches by a click-through rate for the new and the old position; its limit is the rate, which moves with the layout of each results page and which Advanced Web Ranking's July 2026 data puts at 20.02% on average for position 1 on Google US desktop. Your own Search Console click-through rate for the query is the better input where you have it.
What should I record before a link building campaign starts?
Before a link building campaign starts, record a dated baseline for each target page: clicks, impressions, click-through rate and average position from the Search Console Performance report, key events from Google Analytics 4, and referring domains from the link tool the campaign will be tracked with. Save the export, because Search Console keeps 16 months of data, and a campaign measured over a year needs its starting figures kept. Note which tool each figure came from, so the later reading has one fixed point to subtract.
How long before link building ROI can be measured?
Link building ROI cannot be measured on one fixed schedule, because the measures arrive in stages rather than together. The link is live first; a tool finds it after that, and Ahrefs says its crawler can take a few days up to some weeks to find a new link. Position is read next; the sampled timing figure used here is Moz's 2016 sample of 76 links, which took 10 weeks on average to one rank jump, and its author calls the sample a small data set. Clicks and key events follow position, so the return is counted last, and the window over which it is counted is stated with the figure.
What is a good ROI for link building?
A good ROI for link building is one that compares well with your own other channels, costed on the same basis and read over the same window, because those are figures you can verify. What counts as good for one site depends on the value of one key event, the baseline the campaign started from and the window over which the return is counted. There is no sourced benchmark for a link building return, so none is given here.
related Blog Posts



Join 7,000+ Clients Growing with Rhino Rank
Sign Up

Stay ahead of the SEO curve
Get the latest link building strategies, SEO tips and industry insights delivered straight to your inbox.